| Red | Green | Blue | |
| z | 17.64 | ||
| znorm | Inf | ||
| sky | -Inf | -Inf | -Inf |
| S/N | 26.2 | 48.1 | 55.2 |
| S/N(c) | 0.0 | 0.0 | 0.0 |
| SN(E/C) |
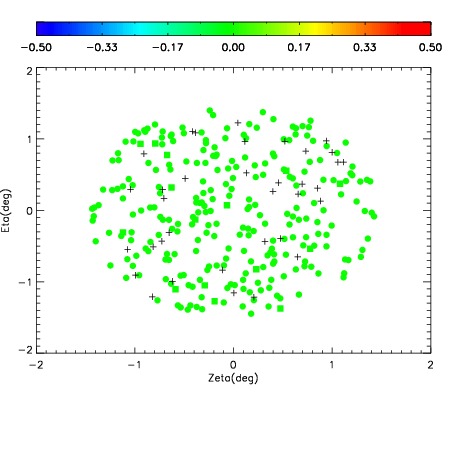
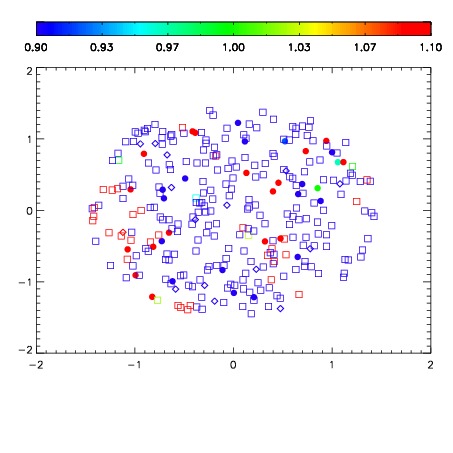
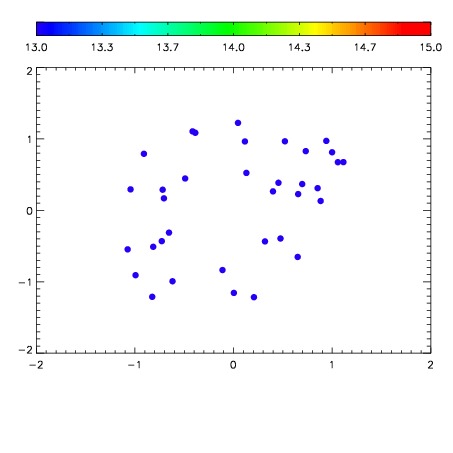

| Frame | Nreads | Zeropoints | Mag plots | Spatial mag deviation | Spatial sky 16325A emission deviations (filled: sky, open: star) | Spatial sky continuum emission | Spatial sky telluric CO2 absorption deviations (filled: H < 10) | |||||||||||||||||||||||
| 0 | 0 |
|
|
|
|
|
|
| IPAIR | NAME | SHIFT | NEWSHIFT | S/N | NAME | SHIFT | NEWSHIFT | S/N |
| 0 | 19540042 | 0.000266448 | 0.00000 | 18.2729 | 19540044 | -0.496364 | 0.496630 | 18.3124 |
| 1 | 19540050 | -0.00178711 | 0.00205356 | 18.3763 | 19540039 | -0.496180 | 0.496446 | 18.3417 |
| 2 | 19540045 | -0.00180532 | 0.00207177 | 18.3424 | 19540051 | -0.493395 | 0.493661 | 18.3238 |
| 3 | 19540053 | -0.00149970 | 0.00176615 | 18.2253 | 19540043 | -0.496039 | 0.496305 | 18.2615 |
| 4 | 19540038 | 0.00000 | 0.000266448 | 18.1823 | 19540047 | -0.495316 | 0.495582 | 18.2014 |
| 5 | 19540046 | -0.000571706 | 0.000838154 | 18.1436 | 19540052 | -0.493852 | 0.494118 | 18.1952 |
| 6 | 19540049 | -0.00267882 | 0.00294527 | 18.1334 | 19540048 | -0.496554 | 0.496820 | 18.0610 |
| 7 | 19540041 | 0.000234879 | 3.15690e-05 | 18.0341 | 19540040 | -0.496159 | 0.496425 | 18.0597 |
| 8 | 19540054 | -0.00126861 | 0.00153506 | 17.7335 | 19540055 | -0.491333 | 0.491599 | 17.6537 |