| Red | Green | Blue | |
| z | 17.64 | ||
| znorm | Inf | ||
| sky | -Inf | -Inf | -Inf |
| S/N | 18.1 | 34.5 | 36.7 |
| S/N(c) | 0.0 | 0.0 | 0.0 |
| SN(E/C) |
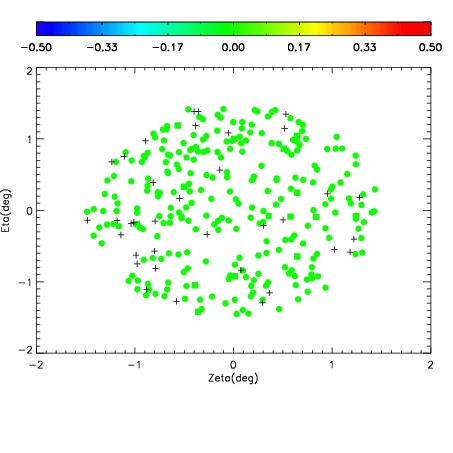
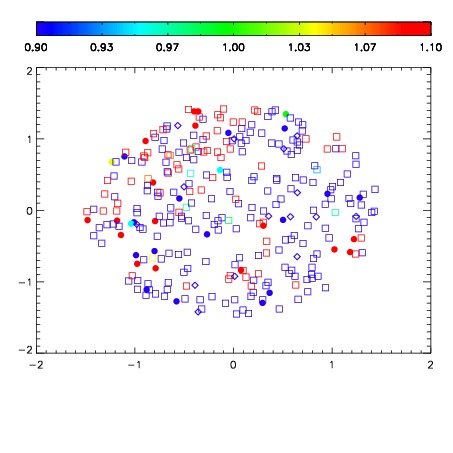


| Frame | Nreads | Zeropoints | Mag plots | Spatial mag deviation | Spatial sky 16325A emission deviations (filled: sky, open: star) | Spatial sky continuum emission | Spatial sky telluric CO2 absorption deviations (filled: H < 10) | |||||||||||||||||||||||
| 0 | 0 |
|
|
|
|
|
|
| IPAIR | NAME | SHIFT | NEWSHIFT | S/N | NAME | SHIFT | NEWSHIFT | S/N |
| 0 | 19860021 | 0.00000 | 0.00000 | 18.0431 | 19860023 | -0.503896 | 0.503896 | 17.9417 |
| 1 | 19860028 | -0.00222198 | 0.00222198 | 18.0173 | 19860022 | -0.503945 | 0.503945 | 17.9366 |
| 2 | 19860025 | -0.00324041 | 0.00324041 | 18.0161 | 19860027 | -0.504602 | 0.504602 | 17.9299 |
| 3 | 19860024 | -0.00388950 | 0.00388950 | 17.9090 | 19860034 | -0.505990 | 0.505990 | 17.9183 |
| 4 | 19860036 | -0.00357508 | 0.00357508 | 17.6870 | 19860035 | -0.505874 | 0.505874 | 17.6804 |
| 5 | 19860029 | -0.00166559 | 0.00166559 | 17.6315 | 19860030 | -0.506931 | 0.506931 | 17.6468 |
| 6 | 19860033 | -0.00289882 | 0.00289882 | 17.3007 | 19860038 | -0.505445 | 0.505445 | 17.5812 |
| 7 | 19860032 | -0.00364233 | 0.00364233 | 17.1096 | 19860031 | -0.507486 | 0.507486 | 17.1348 |
| 8 | 19860037 | -0.00341773 | 0.00341773 | 16.9945 | 19860026 | -0.504704 | 0.504704 | 16.2443 |