| Red | Green | Blue | |
| z | 17.64 | ||
| znorm | Inf | ||
| sky | -Inf | -Inf | -Inf |
| S/N | 17.6 | 33.6 | 34.2 |
| S/N(c) | 0.0 | 0.0 | 0.0 |
| SN(E/C) |
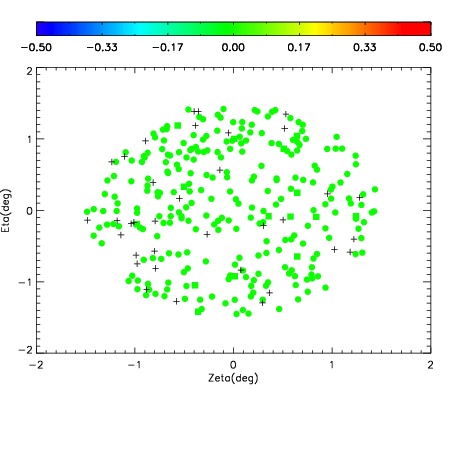
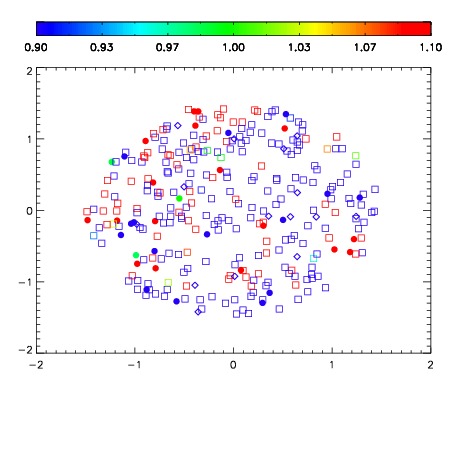


| Frame | Nreads | Zeropoints | Mag plots | Spatial mag deviation | Spatial sky 16325A emission deviations (filled: sky, open: star) | Spatial sky continuum emission | Spatial sky telluric CO2 absorption deviations (filled: H < 10) | |||||||||||||||||||||||
| 0 | 0 |
|
|
|
|
|
|
| IPAIR | NAME | SHIFT | NEWSHIFT | S/N | NAME | SHIFT | NEWSHIFT | S/N |
| 0 | 19880029 | 0.509622 | 0.00000 | 15.8430 | 19880030 | 0.0159087 | 0.493713 | 16.4017 |
| 1 | 19880012 | 0.502836 | 0.00678599 | 18.3155 | 19880011 | 0.00000 | 0.509622 | 18.3513 |
| 2 | 19880013 | 0.503311 | 0.00631100 | 18.1813 | 19880018 | 0.00480942 | 0.504813 | 18.0650 |
| 3 | 19880020 | 0.502948 | 0.00667399 | 17.9666 | 19880019 | 0.00559009 | 0.504032 | 17.8871 |
| 4 | 19880017 | 0.506247 | 0.00337499 | 17.6285 | 19880014 | 0.00244951 | 0.507172 | 17.8614 |
| 5 | 19880021 | 0.504599 | 0.00502300 | 17.4833 | 19880015 | 0.00417336 | 0.505449 | 17.6000 |
| 6 | 19880016 | 0.506057 | 0.00356495 | 17.4543 | 19880026 | 0.0128222 | 0.496800 | 17.0876 |
| 7 | 19880025 | 0.507039 | 0.00258297 | 17.0528 | 19880027 | 0.0133918 | 0.496230 | 17.0288 |
| 8 | 19880028 | 0.509490 | 0.000131965 | 17.0144 | 19880023 | 0.0105253 | 0.499097 | 16.8767 |
| 9 | 19880024 | 0.507184 | 0.00243795 | 16.3686 | 19880022 | 0.0106035 | 0.499018 | 16.6985 |