| Red | Green | Blue | |
| z | 17.64 | ||
| znorm | Inf | ||
| sky | -Inf | -Inf | -Inf |
| S/N | 15.7 | 28.4 | 30.5 |
| S/N(c) | 0.0 | 0.0 | 0.0 |
| SN(E/C) |
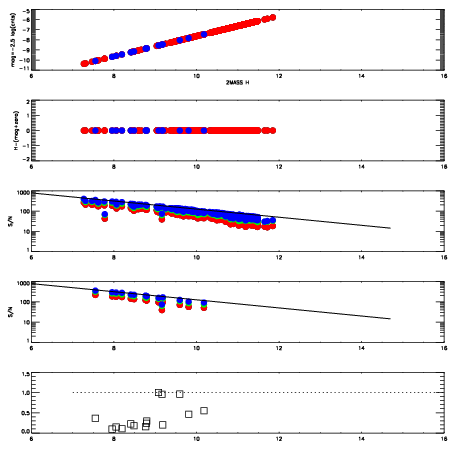


| Frame | Nreads | Zeropoints | Mag plots | Spatial mag deviation | Spatial sky 16325A emission deviations (filled: sky, open: star) | Spatial sky continuum emission | Spatial sky telluric CO2 absorption deviations (filled: H < 10) | |||||||||||||||||||||||
| 0 | 0 |
|
|
|
|
|
|
| IPAIR | NAME | SHIFT | NEWSHIFT | S/N | NAME | SHIFT | NEWSHIFT | S/N |
| 0 | 20060020 | 0.502019 | 0.00000 | 16.8272 | 20060015 | 0.000604883 | 0.501414 | 17.9748 |
| 1 | 20060017 | 0.500001 | 0.00201797 | 18.2422 | 20060018 | -0.000634747 | 0.502654 | 18.2859 |
| 2 | 20060016 | 0.499601 | 0.00241798 | 18.0454 | 20060019 | -0.000449675 | 0.502469 | 18.2243 |
| 3 | 20060013 | 0.500637 | 0.00138199 | 17.8806 | 20060014 | 0.000186781 | 0.501832 | 18.1078 |
| 4 | 20060012 | 0.500866 | 0.00115299 | 15.2009 | 20060011 | 0.00000 | 0.502019 | 17.9322 |