| Red | Green | Blue | |
| z | 17.64 | ||
| znorm | Inf | ||
| sky | -Inf | -Inf | -NaN |
| S/N | 21.3 | 38.0 | 41.4 |
| S/N(c) | 0.0 | 0.0 | 0.0 |
| SN(E/C) |


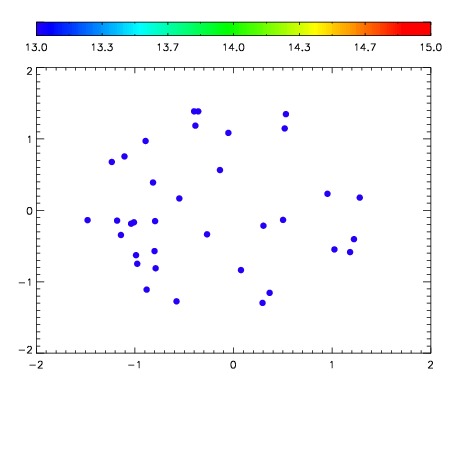

| Frame | Nreads | Zeropoints | Mag plots | Spatial mag deviation | Spatial sky 16325A emission deviations (filled: sky, open: star) | Spatial sky continuum emission | Spatial sky telluric CO2 absorption deviations (filled: H < 10) | |||||||||||||||||||||||
| 0 | 0 |
|
|
|
|
|
|
| IPAIR | NAME | SHIFT | NEWSHIFT | S/N | NAME | SHIFT | NEWSHIFT | S/N |
| 0 | 20070013 | 0.504886 | 0.00000 | 18.1780 | 20070015 | 0.000439246 | 0.504447 | 18.2338 |
| 1 | 20070017 | 0.501648 | 0.00323796 | 18.5072 | 20070018 | -0.00121940 | 0.506105 | 18.5665 |
| 2 | 20070020 | 0.502739 | 0.00214696 | 18.3493 | 20070019 | 0.000751560 | 0.504134 | 18.3718 |
| 3 | 20070012 | 0.502773 | 0.00211298 | 18.3480 | 20070011 | 0.00000 | 0.504886 | 18.3534 |
| 4 | 20070021 | 0.503116 | 0.00176996 | 18.0484 | 20070014 | 0.00203896 | 0.502847 | 17.9491 |
| 5 | 20070016 | 0.502901 | 0.00198495 | 17.7246 | 20070022 | 0.00268291 | 0.502203 | 17.8106 |