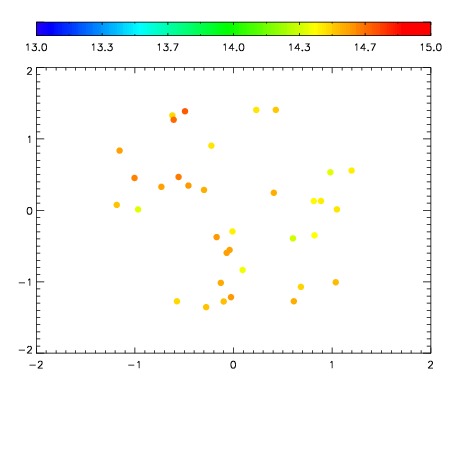
| Frame | Nreads | Zeropoints | Mag plots
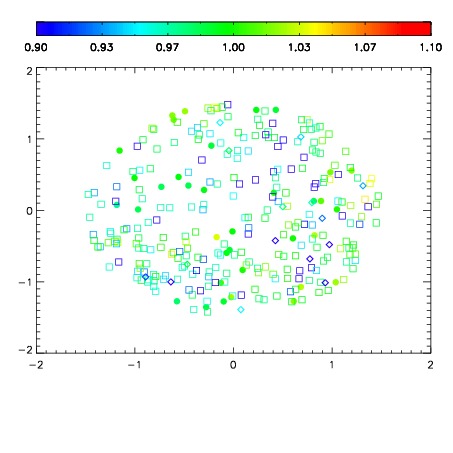
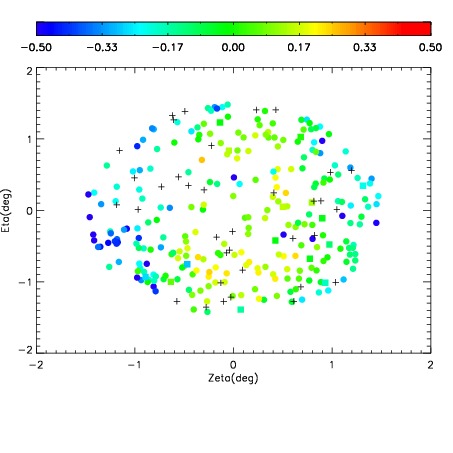
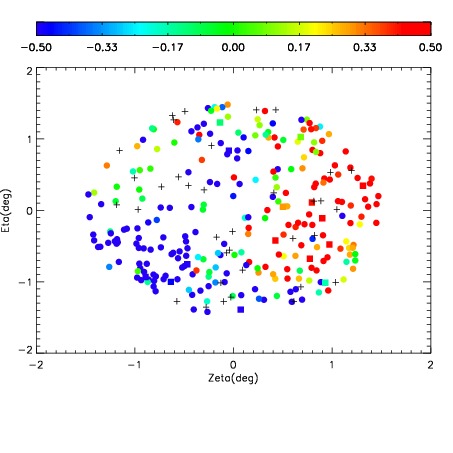
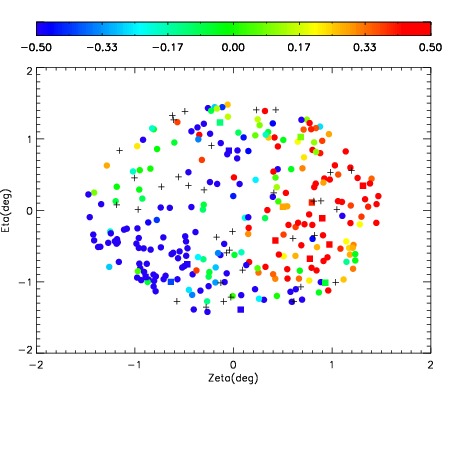
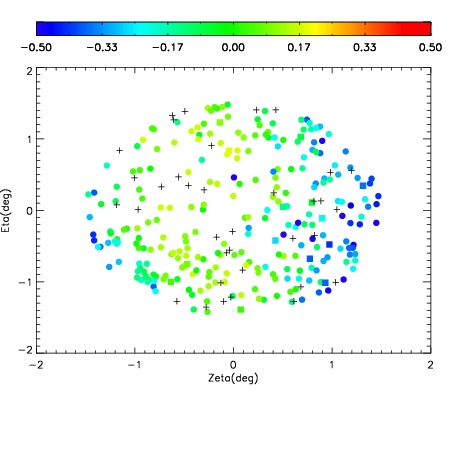
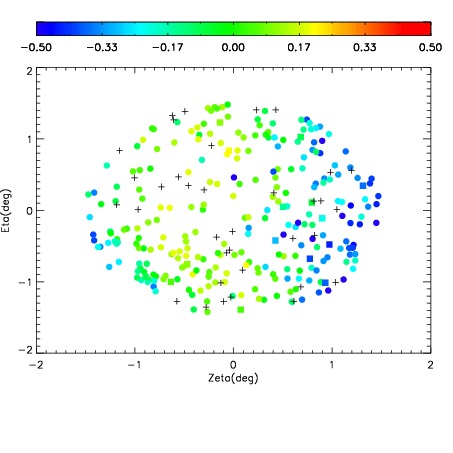
| Spatial mag deviation
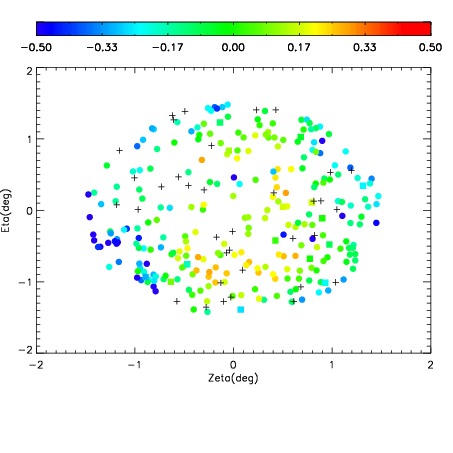
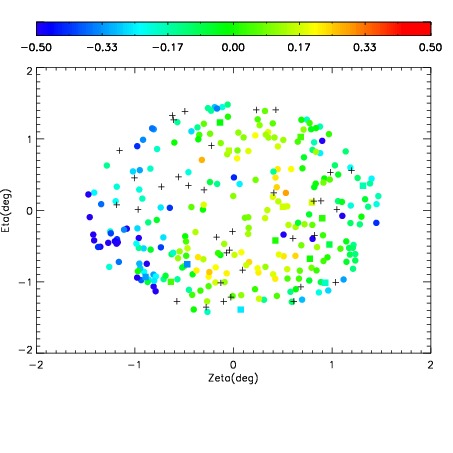
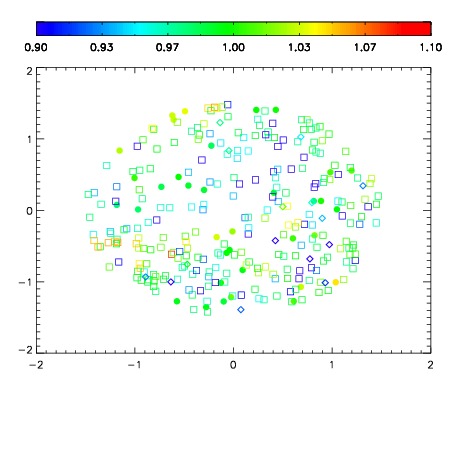
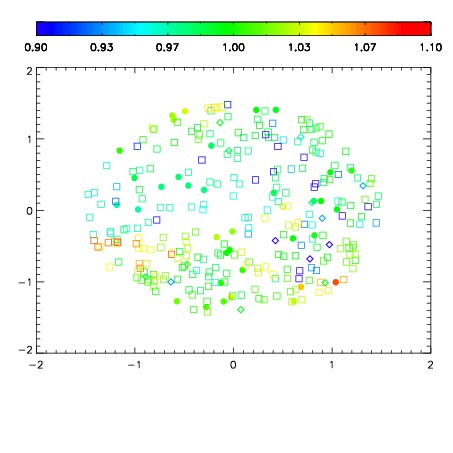
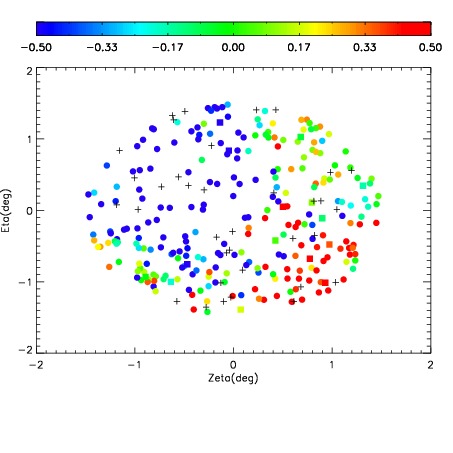
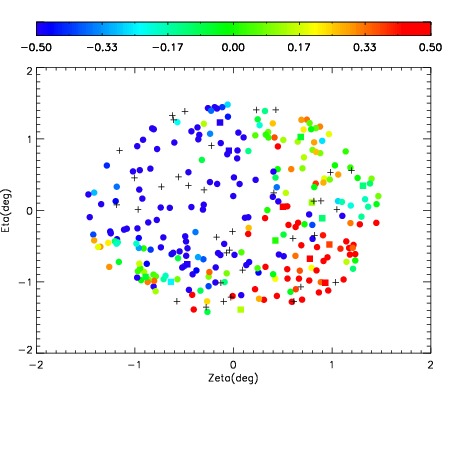
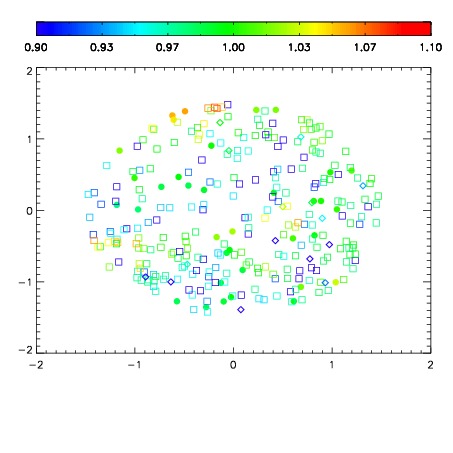
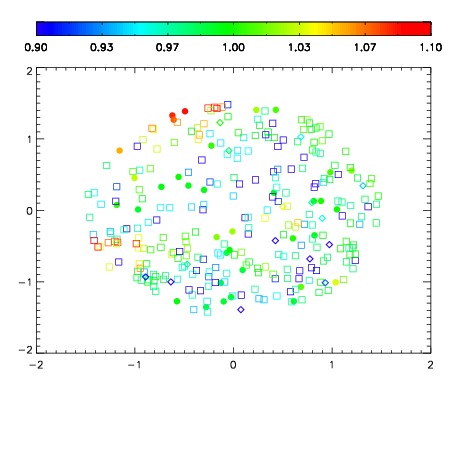
| Spatial sky 16325A emission deviations (filled: sky, open: star)
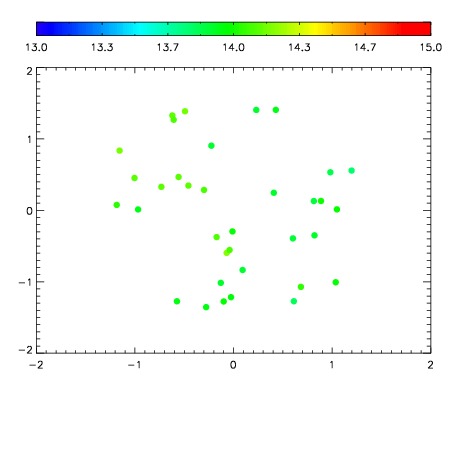
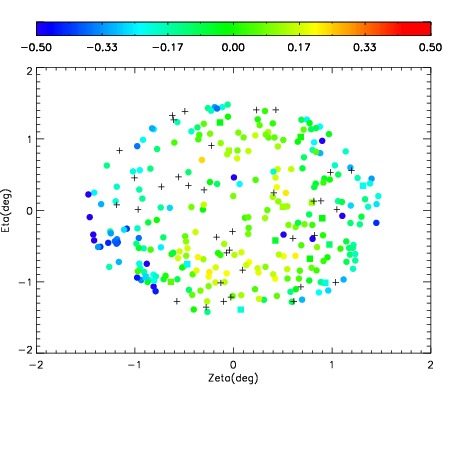
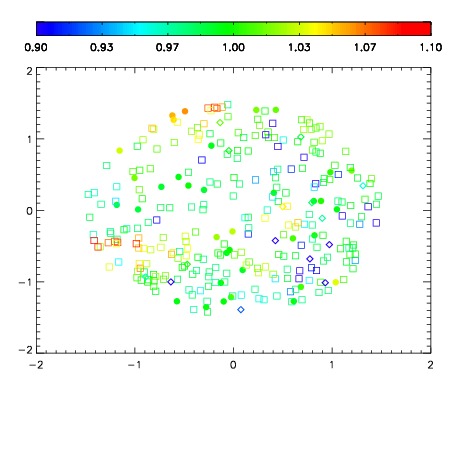
| Spatial sky continuum emission
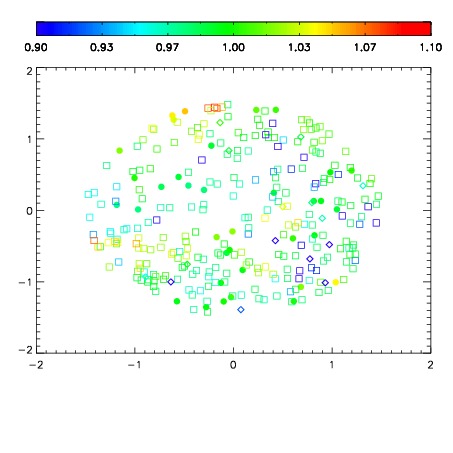
| Spatial sky telluric CO2 absorption deviations (filled: H < 10)
|
| 19760010
| 47
| | Red | Green | Blue
| | z | | 18.80
| | znorm | | 14.62
| | sky | 13.9 | 13.7 | 13.3
| | S/N | 11.9 | 17.2 | 21.3
| | S/N(c) | 17.0 | 22.2 | 16.9
| | SN(E/C) 0.48
|
| 
| 
| 
| 
| 
|
| 19760011
| 47
| | Red | Green | Blue
| | z | | 18.82
| | znorm | | 14.64
| | sky | 14.1 | 14.0 | 13.9
| | S/N | 11.3 | 16.6 | 20.9
| | S/N(c) | 16.8 | 22.5 | 17.0
| | SN(E/C) 0.47
|
| 
| 
| 
| 
| 
|
| 19760012
| 47
| | Red | Green | Blue
| | z | | 18.88
| | znorm | | 14.70
| | sky | 14.3 | 14.1 | 14.0
| | S/N | 12.6 | 18.2 | 22.7
| | S/N(c) | 17.7 | 23.1 | 17.6
| | SN(E/C) 0.44
|
| 
| 
| 
| 
| 
|
| 19760013
| 47
| | Red | Green | Blue
| | z | | 18.95
| | znorm | | 14.77
| | sky | 14.3 | 14.2 | 14.0
| | S/N | 13.4 | 19.3 | 24.3
| | S/N(c) | 18.0 | 24.0 | 18.2
| | SN(E/C) 0.40
|
| 
| 
| 
| 
| 
|
| 19760014
| 42
| | Red | Green | Blue
| | z | | 17.68
| | znorm | | 13.62
| | sky | 14.3 | 14.2 | 14.3
| | S/N | 2.1 | 5.1 | 5.3
| | S/N(c) | 7.7 | 12.2 | 8.9
| | SN(E/C) 0.69
|
| 
| 
| 
| 
| 
|
| 19760015
| 42
| | Red | Green | Blue
| | z | | 17.71
| | znorm | | 13.65
| | sky | 14.7 | 14.5 | 14.3
| | S/N | 2.2 | 5.0 | 5.7
| | S/N(c) | 7.7 | 12.3 | 9.2
| | SN(E/C) 0.65
|
| 
| 
| 
| 
| 
|
| 19760016
| 42
| | Red | Green | Blue
| | z | | 17.85
| | znorm | | 13.79
| | sky | 14.6 | 14.6 | 14.3
| | S/N | 5.9 | 9.8 | 11.6
| | S/N(c) | 8.9 | 13.7 | 10.1
| | SN(E/C) 0.61
|
| 
| 
| 
| 
| 
|
| 19760017
| 42
| | Red | Green | Blue
| | z | | 17.87
| | znorm | | 13.81
| | sky | 14.5 | 14.6 | 14.3
| | S/N | 5.6 | 9.8 | 11.0
| | S/N(c) | 8.9 | 13.5 | 10.1
| | SN(E/C) 0.62
|
| 
| 
| 
| 
| 
|
| 19760018
| 42
| | Red | Green | Blue
| | z | | 18.86
| | znorm | | 14.80
| | sky | 14.2 | 14.3 | 14.4
| | S/N | 13.3 | 19.7 | 24.7
| | S/N(c) | 17.3 | 23.1 | 17.8
| | SN(E/C) 0.51
|
| 
| 
| 
| 
| 
|
| 19760019
| 42
| | Red | Green | Blue
| | z | | 18.80
| | znorm | | 14.74
| | sky | 14.4 | 14.5 | 14.4
| | S/N | 12.9 | 19.3 | 24.1
| | S/N(c) | 16.9 | 22.6 | 17.3
| | SN(E/C) 0.48
|
| 
| 
| 
| 
| 
|