| Red | Green | Blue | |
| z | 17.64 | ||
| znorm | Inf | ||
| sky | -Inf | -NaN | -NaN |
| S/N | 20.3 | 31.6 | 39.0 |
| S/N(c) | 0.0 | 0.0 | 0.0 |
| SN(E/C) |


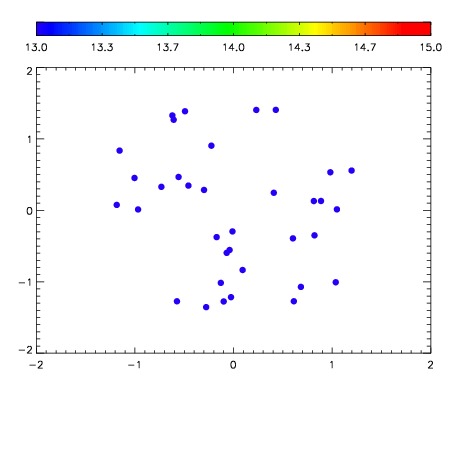

| Frame | Nreads | Zeropoints | Mag plots | Spatial mag deviation | Spatial sky 16325A emission deviations (filled: sky, open: star) | Spatial sky continuum emission | Spatial sky telluric CO2 absorption deviations (filled: H < 10) | |||||||||||||||||||||||
| 0 | 0 |
|
|
|
|
|
|
| IPAIR | NAME | SHIFT | NEWSHIFT | S/N | NAME | SHIFT | NEWSHIFT | S/N |
| 0 | 19760019 | 0.503449 | 0.00000 | 18.7513 | 19760010 | 0.00000 | 0.503449 | 18.7417 |
| 1 | 19760012 | 0.496764 | 0.00668502 | 18.8356 | 19760013 | 0.00302373 | 0.500425 | 18.9003 |
| 2 | 19760011 | 0.496091 | 0.00735801 | 18.7825 | 19760018 | 0.00473826 | 0.498711 | 18.8092 |
| 3 | 19760016 | 0.500176 | 0.00327301 | 17.7670 | 19760017 | 0.00536459 | 0.498084 | 17.7924 |
| 4 | 19760015 | 0.499017 | 0.00443202 | 17.6400 | 19760014 | 0.00417372 | 0.499275 | 17.6218 |