| Red | Green | Blue | |
| z | 17.64 | ||
| znorm | Inf | ||
| sky | -Inf | -Inf | -NaN |
| S/N | 17.1 | 29.7 | 35.9 |
| S/N(c) | 0.0 | 0.0 | 0.0 |
| SN(E/C) |


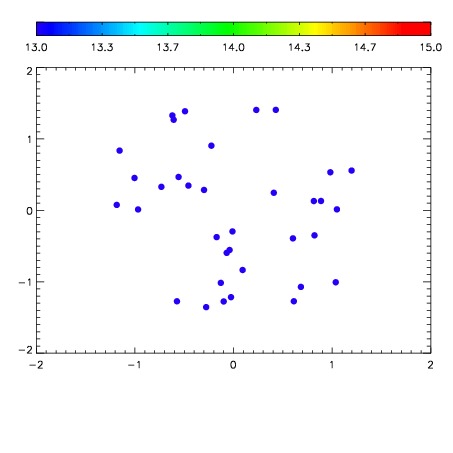

| Frame | Nreads | Zeropoints | Mag plots | Spatial mag deviation | Spatial sky 16325A emission deviations (filled: sky, open: star) | Spatial sky continuum emission | Spatial sky telluric CO2 absorption deviations (filled: H < 10) | |||||||||||||||||||||||
| 0 | 0 |
|
|
|
|
|
|
| IPAIR | NAME | SHIFT | NEWSHIFT | S/N | NAME | SHIFT | NEWSHIFT | S/N |
| 0 | 19820024 | 0.00166798 | 0.00000 | 18.1553 | 19820025 | -0.488160 | 0.489828 | 18.2664 |
| 1 | 19820031 | 0.000147951 | 0.00152003 | 18.1485 | 19820022 | -0.516427 | 0.518095 | 18.1372 |
| 2 | 19820020 | 0.00000 | 0.00166798 | 18.1273 | 19820021 | -0.490909 | 0.492577 | 18.0512 |
| 3 | 19820027 | -9.08493e-05 | 0.00175883 | 18.0380 | 19820026 | -0.488840 | 0.490508 | 18.0204 |
| 4 | 19820023 | 0.000736122 | 0.000931858 | 18.0254 | 19820030 | -0.488689 | 0.490357 | 17.9943 |
| 5 | 19820028 | 0.00119732 | 0.000470660 | 17.8308 | 19820029 | -0.489038 | 0.490706 | 17.7825 |