| Red | Green | Blue | |
| z | 17.64 | ||
| znorm | Inf | ||
| sky | -Inf | -NaN | -NaN |
| S/N | 15.0 | 24.9 | 30.4 |
| S/N(c) | 0.0 | 0.0 | 0.0 |
| SN(E/C) |
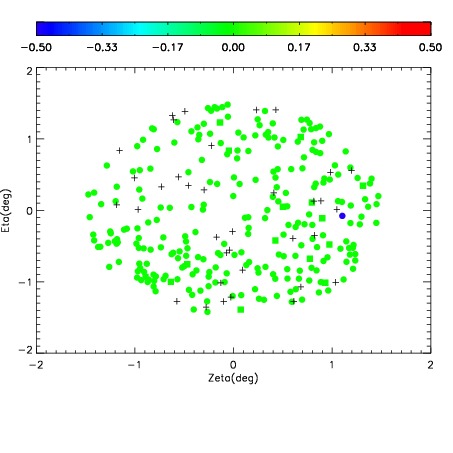
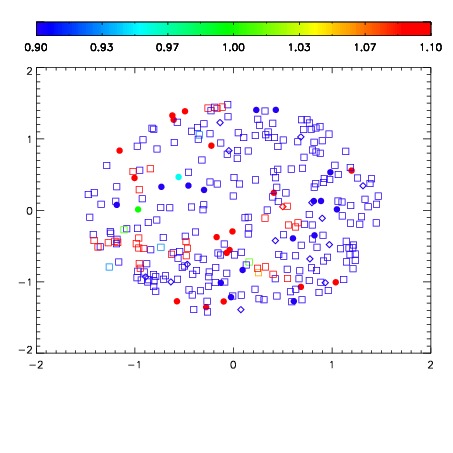
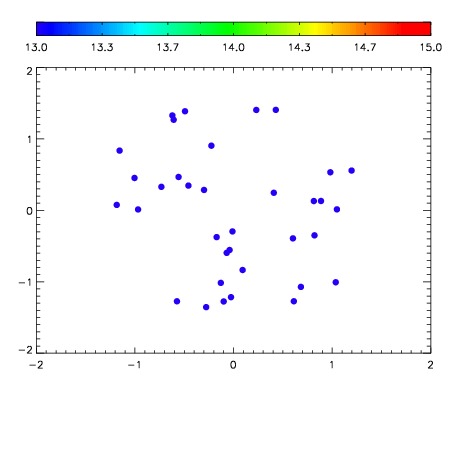

| Frame | Nreads | Zeropoints | Mag plots | Spatial mag deviation | Spatial sky 16325A emission deviations (filled: sky, open: star) | Spatial sky continuum emission | Spatial sky telluric CO2 absorption deviations (filled: H < 10) | |||||||||||||||||||||||
| 0 | 0 |
|
|
|
|
|
|
| IPAIR | NAME | SHIFT | NEWSHIFT | S/N | NAME | SHIFT | NEWSHIFT | S/N |
| 0 | 19900048 | 0.00281039 | 0.00000 | 17.5589 | 19900049 | -0.496406 | 0.499216 | 17.5286 |
| 1 | 19900044 | 0.00000 | 0.00281039 | 18.5414 | 19900045 | -0.499604 | 0.502414 | 18.5618 |
| 2 | 19900047 | 0.00226890 | 0.000541490 | 18.4660 | 19900046 | -0.499548 | 0.502358 | 18.4007 |