| Red | Green | Blue | |
| z | 17.64 | ||
| znorm | Inf | ||
| sky | -Inf | -Inf | -Inf |
| S/N | 30.9 | 52.0 | 56.4 |
| S/N(c) | 0.0 | 0.0 | 0.0 |
| SN(E/C) |

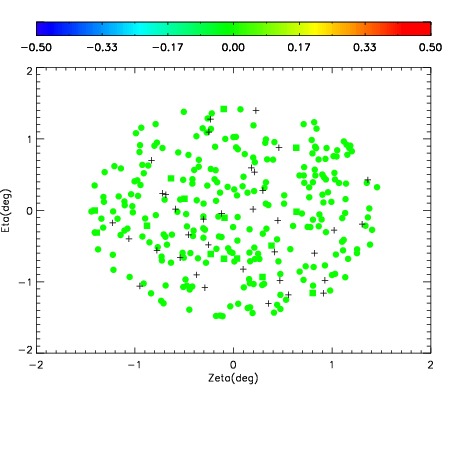
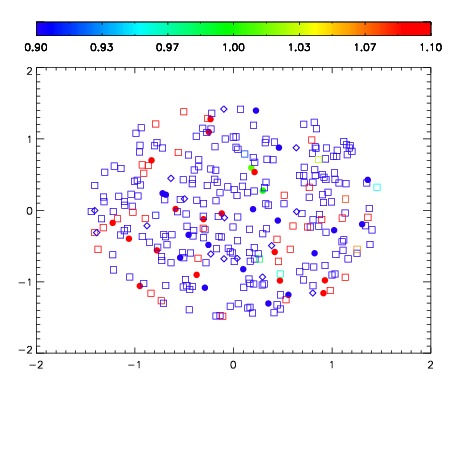
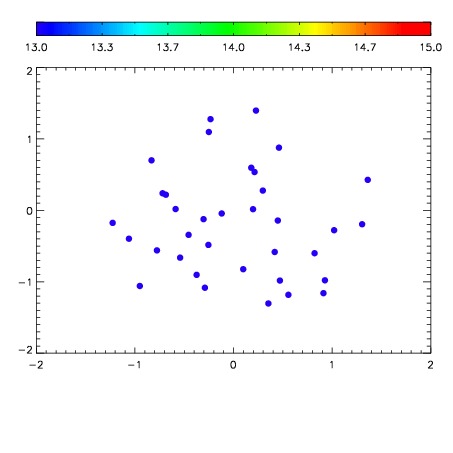

| Frame | Nreads | Zeropoints | Mag plots | Spatial mag deviation | Spatial sky 16325A emission deviations (filled: sky, open: star) | Spatial sky continuum emission | Spatial sky telluric CO2 absorption deviations (filled: H < 10) | |||||||||||||||||||||||
| 0 | 0 |
|
|
|
|
|
|
| IPAIR | NAME | SHIFT | NEWSHIFT | S/N | NAME | SHIFT | NEWSHIFT | S/N |
| 0 | 19740023 | 0.499647 | 0.00000 | 18.0051 | 19740022 | 0.00328070 | 0.496366 | 17.9645 |
| 1 | 19740012 | 0.498272 | 0.00137499 | 18.9310 | 19740013 | -0.00240183 | 0.502049 | 18.8583 |
| 2 | 19740011 | 0.497651 | 0.00199598 | 18.8927 | 19740010 | 0.00000 | 0.499647 | 18.8445 |
| 3 | 19740019 | 0.497132 | 0.00251499 | 18.8070 | 19740025 | 0.00490715 | 0.494740 | 18.7882 |
| 4 | 19740024 | 0.497705 | 0.00194198 | 18.7339 | 19740018 | 0.00342607 | 0.496221 | 18.7622 |
| 5 | 19740020 | 0.498189 | 0.00145799 | 17.8544 | 19740021 | 0.00255471 | 0.497092 | 17.9171 |
| 6 | 19740016 | 0.498626 | 0.00102100 | 17.7825 | 19740017 | 0.00571225 | 0.493935 | 17.8808 |
| 7 | 19740015 | 0.496777 | 0.00286999 | 17.6711 | 19740014 | -0.00175602 | 0.501403 | 17.5938 |