| Red | Green | Blue | |
| z | 17.64 | ||
| znorm | Inf | ||
| sky | -Inf | -Inf | -Inf |
| S/N | 31.0 | 51.9 | 56.5 |
| S/N(c) | 0.0 | 0.0 | 0.0 |
| SN(E/C) |
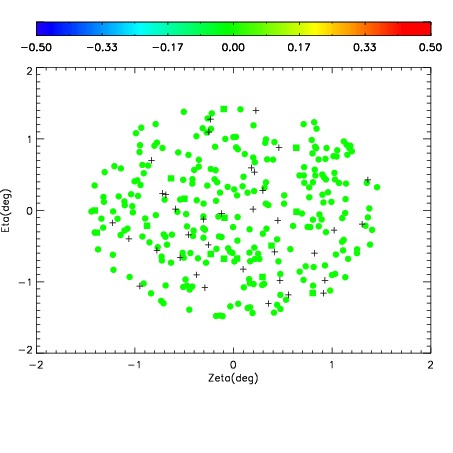
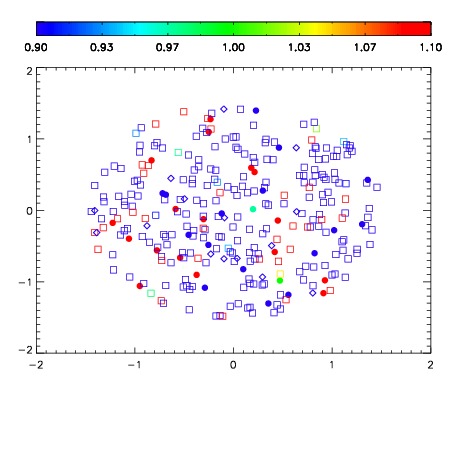
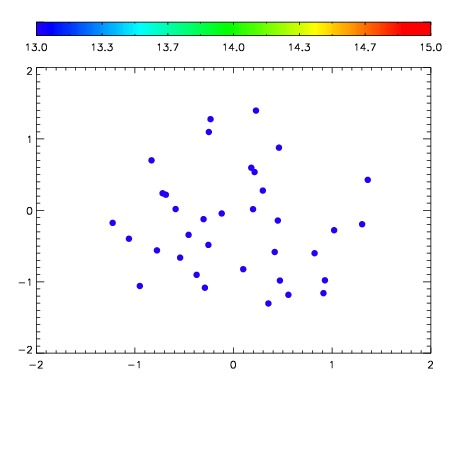

| Frame | Nreads | Zeropoints | Mag plots | Spatial mag deviation | Spatial sky 16325A emission deviations (filled: sky, open: star) | Spatial sky continuum emission | Spatial sky telluric CO2 absorption deviations (filled: H < 10) | |||||||||||||||||||||||
| 0 | 0 |
|
|
|
|
|
|
| IPAIR | NAME | SHIFT | NEWSHIFT | S/N | NAME | SHIFT | NEWSHIFT | S/N |
| 0 | 19750024 | 0.501066 | 0.00000 | 18.1214 | 19750023 | 0.00864870 | 0.492417 | 18.0953 |
| 1 | 19750013 | 0.494707 | 0.00635904 | 19.0072 | 19750014 | 0.00154350 | 0.499523 | 18.9933 |
| 2 | 19750012 | 0.494151 | 0.00691503 | 18.9377 | 19750011 | 0.00000 | 0.501066 | 18.9184 |
| 3 | 19750020 | 0.496548 | 0.00451803 | 18.7779 | 19750019 | 0.00490993 | 0.496156 | 18.7958 |
| 4 | 19750025 | 0.500748 | 0.000318050 | 18.6334 | 19750026 | 0.00656265 | 0.494503 | 18.6414 |
| 5 | 19750021 | 0.498373 | 0.00269303 | 18.0319 | 19750022 | 0.00795172 | 0.493114 | 18.0190 |
| 6 | 19750017 | 0.498289 | 0.00277704 | 17.9185 | 19750018 | 0.00589370 | 0.495172 | 17.9534 |
| 7 | 19750016 | 0.496300 | 0.00476602 | 17.8695 | 19750015 | 0.00298449 | 0.498082 | 17.7985 |