| Red | Green | Blue | |
| z | 17.64 | ||
| znorm | Inf | ||
| sky | -Inf | -Inf | -NaN |
| S/N | 19.7 | 35.9 | 39.5 |
| S/N(c) | 0.0 | 0.0 | 0.0 |
| SN(E/C) |
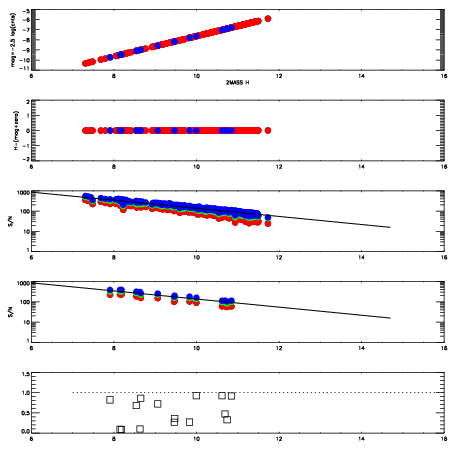
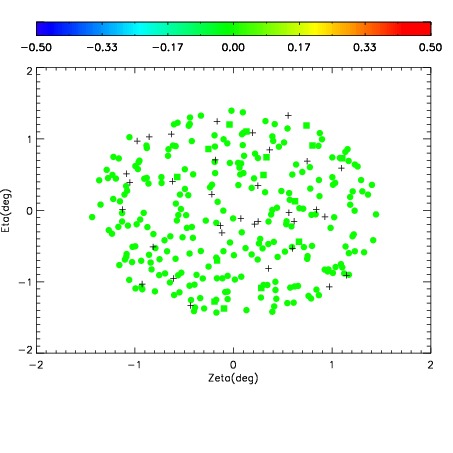
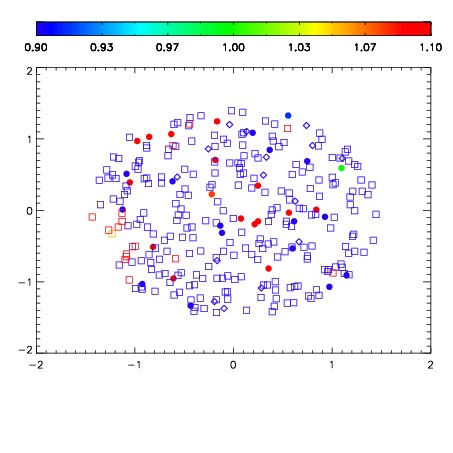
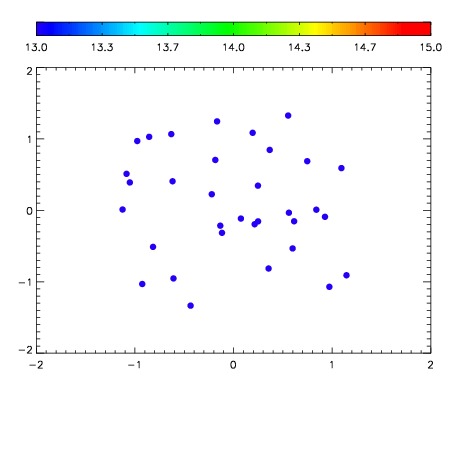

| Frame | Nreads | Zeropoints | Mag plots | Spatial mag deviation | Spatial sky 16325A emission deviations (filled: sky, open: star) | Spatial sky continuum emission | Spatial sky telluric CO2 absorption deviations (filled: H < 10) | |||||||||||||||||||||||
| 0 | 0 |
|
|
|
|
|
|
| IPAIR | NAME | SHIFT | NEWSHIFT | S/N | NAME | SHIFT | NEWSHIFT | S/N |
| 0 | 19560044 | 0.494453 | 0.00000 | 17.6836 | 19560045 | 0.00115279 | 0.493300 | 17.5790 |
| 1 | 19560040 | 0.490575 | 0.00387803 | 18.6831 | 19560041 | -0.00319240 | 0.497645 | 18.6908 |
| 2 | 19560035 | 0.490392 | 0.00406101 | 18.6771 | 19560034 | 0.00000 | 0.494453 | 18.6265 |
| 3 | 19560043 | 0.492440 | 0.00201303 | 18.5775 | 19560042 | -0.00236977 | 0.496823 | 18.5407 |
| 4 | 19560036 | 0.491330 | 0.00312302 | 18.4866 | 19560037 | -0.000454483 | 0.494907 | 18.4471 |
| 5 | 19560039 | 0.491207 | 0.00324601 | 17.9679 | 19560038 | 0.000359277 | 0.494094 | 17.9996 |