| Red | Green | Blue | |
| z | 17.64 | ||
| znorm | Inf | ||
| sky | -Inf | -Inf | -NaN |
| S/N | 13.5 | 24.6 | 27.1 |
| S/N(c) | 0.0 | 0.0 | 0.0 |
| SN(E/C) |
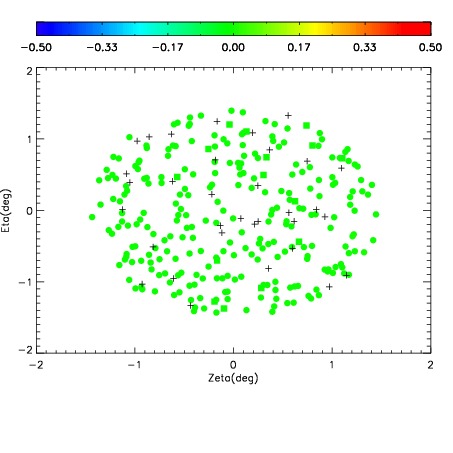
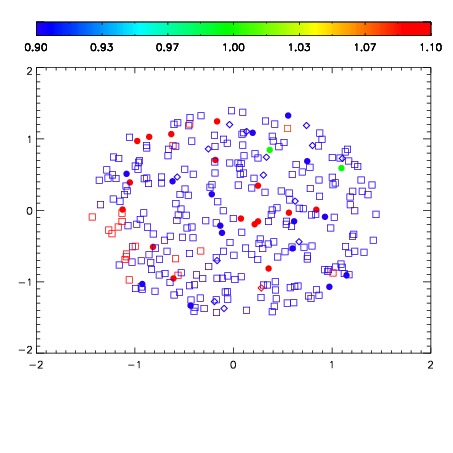
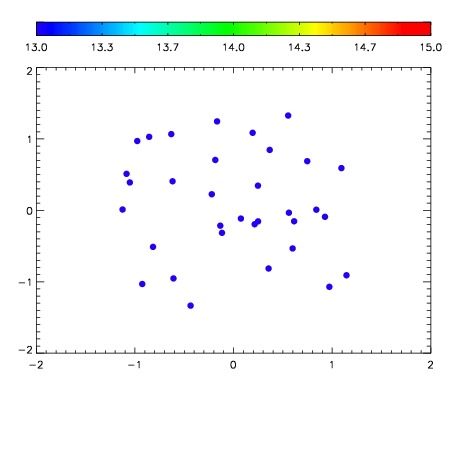

| Frame | Nreads | Zeropoints | Mag plots | Spatial mag deviation | Spatial sky 16325A emission deviations (filled: sky, open: star) | Spatial sky continuum emission | Spatial sky telluric CO2 absorption deviations (filled: H < 10) | |||||||||||||||||||||||
| 0 | 0 |
|
|
|
|
|
|
| IPAIR | NAME | SHIFT | NEWSHIFT | S/N | NAME | SHIFT | NEWSHIFT | S/N |
| 0 | 19590067 | 0.502282 | 0.00000 | 17.6036 | 19590066 | 0.00408903 | 0.498193 | 17.6759 |
| 1 | 19590063 | 0.499283 | 0.00299904 | 18.5842 | 19590062 | 0.00000 | 0.502282 | 18.6029 |
| 2 | 19590064 | 0.500629 | 0.00165302 | 18.5455 | 19590065 | 0.00366417 | 0.498618 | 18.4176 |