| Red | Green | Blue | |
| z | 17.64 | ||
| znorm | Inf | ||
| sky | -Inf | -Inf | -Inf |
| S/N | 9.9 | 19.6 | 21.6 |
| S/N(c) | 0.0 | 0.0 | 0.0 |
| SN(E/C) |
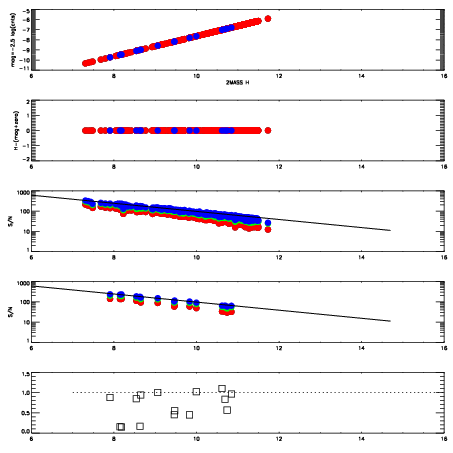
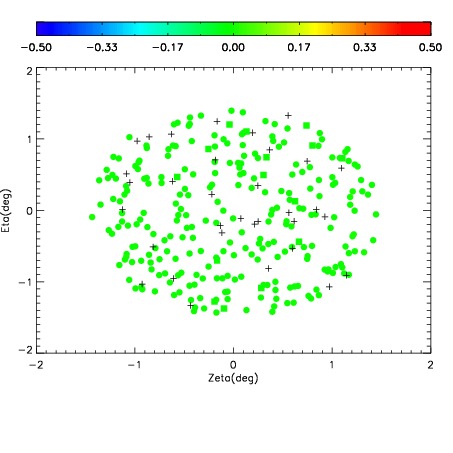
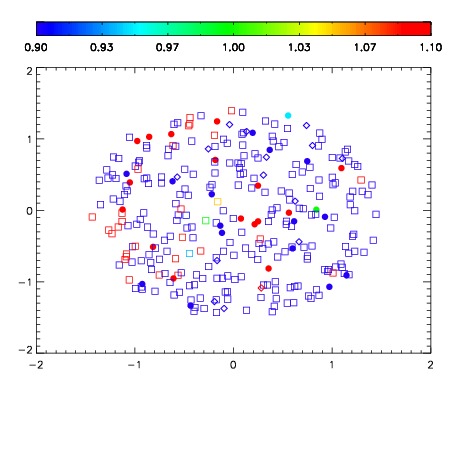
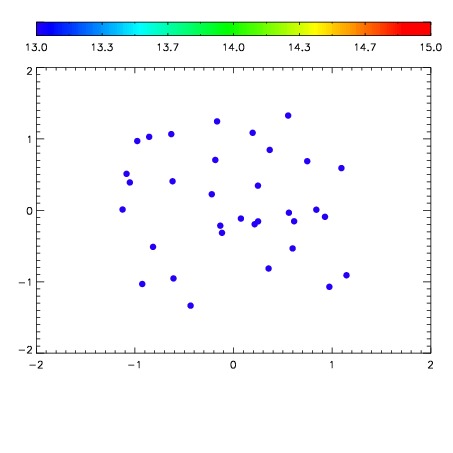

| Frame | Nreads | Zeropoints | Mag plots | Spatial mag deviation | Spatial sky 16325A emission deviations (filled: sky, open: star) | Spatial sky continuum emission | Spatial sky telluric CO2 absorption deviations (filled: H < 10) | |||||||||||||||||||||||
| 0 | 0 |
|
|
|
|
|
|
| IPAIR | NAME | SHIFT | NEWSHIFT | S/N | NAME | SHIFT | NEWSHIFT | S/N |
| 0 | 19600055 | 0.00272594 | 0.00000 | 17.7712 | 19600056 | -0.493937 | 0.496663 | 17.5740 |
| 1 | 19600054 | 0.00163330 | 0.00109264 | 18.2769 | 19600052 | -0.492892 | 0.495618 | 18.1763 |
| 2 | 19600051 | 0.00000 | 0.00272594 | 18.2350 | 19600053 | -0.493259 | 0.495985 | 17.9901 |