| Red | Green | Blue | |
| z | 17.64 | ||
| znorm | Inf | ||
| sky | -Inf | -Inf | -NaN |
| S/N | 17.3 | 27.5 | 34.4 |
| S/N(c) | 0.0 | 0.0 | 0.0 |
| SN(E/C) |
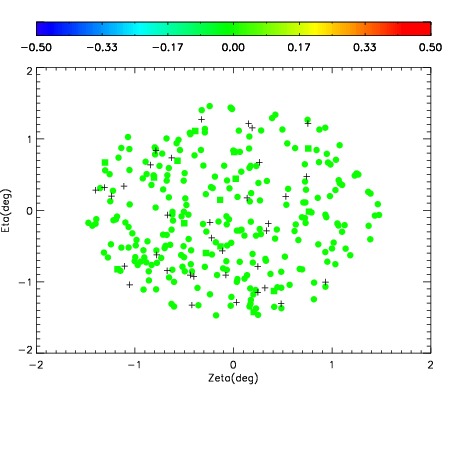
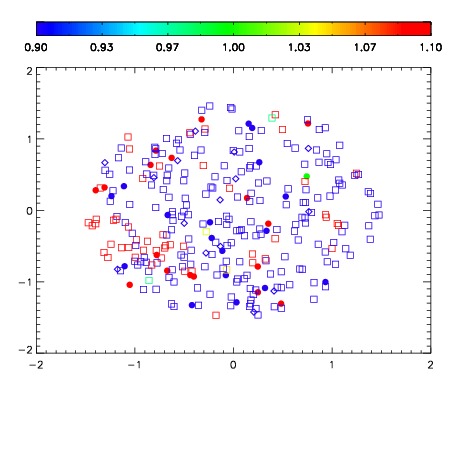


| Frame | Nreads | Zeropoints | Mag plots | Spatial mag deviation | Spatial sky 16325A emission deviations (filled: sky, open: star) | Spatial sky continuum emission | Spatial sky telluric CO2 absorption deviations (filled: H < 10) | |||||||||||||||||||||||
| 0 | 0 |
|
|
|
|
|
|
| IPAIR | NAME | SHIFT | NEWSHIFT | S/N | NAME | SHIFT | NEWSHIFT | S/N |
| 0 | 20110032 | 0.505324 | 0.00000 | 18.5168 | 20110037 | -0.00115320 | 0.506477 | 18.5424 |
| 1 | 20110039 | 0.504193 | 0.00113100 | 18.6514 | 20110038 | 4.68948e-05 | 0.505277 | 18.6739 |
| 2 | 20110036 | 0.499635 | 0.00568900 | 18.4915 | 20110033 | -0.00127989 | 0.506604 | 18.5019 |
| 3 | 20110031 | 0.505176 | 0.000147998 | 18.3919 | 20110030 | 0.00000 | 0.505324 | 18.3059 |
| 4 | 20110035 | 0.499544 | 0.00578001 | 18.1219 | 20110034 | -0.00161910 | 0.506943 | 18.2026 |