| Red | Green | Blue | |
| z | 17.64 | ||
| znorm | Inf | ||
| sky | -Inf | -Inf | -NaN |
| S/N | 15.6 | 26.1 | 30.9 |
| S/N(c) | 0.0 | 0.0 | 0.0 |
| SN(E/C) |
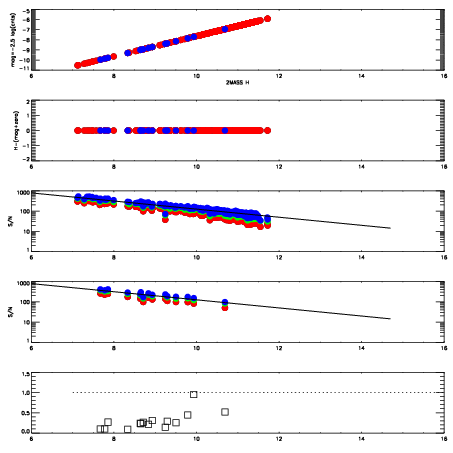


| Frame | Nreads | Zeropoints | Mag plots | Spatial mag deviation | Spatial sky 16325A emission deviations (filled: sky, open: star) | Spatial sky continuum emission | Spatial sky telluric CO2 absorption deviations (filled: H < 10) | |||||||||||||||||||||||
| 0 | 0 |
|
|
|
|
|
|
| IPAIR | NAME | SHIFT | NEWSHIFT | S/N | NAME | SHIFT | NEWSHIFT | S/N |
| 0 | 20120017 | 0.499662 | 0.00000 | 18.4081 | 20120014 | -0.00218403 | 0.501846 | 18.4194 |
| 1 | 20120016 | 0.498752 | 0.000910014 | 18.4795 | 20120015 | -0.00313374 | 0.502796 | 18.5345 |
| 2 | 20120013 | 0.499469 | 0.000193000 | 18.3944 | 20120018 | -3.11376e-05 | 0.499693 | 18.4121 |
| 3 | 20120020 | 0.499018 | 0.000643998 | 18.2856 | 20120019 | -0.000111100 | 0.499773 | 18.3566 |
| 4 | 20120012 | 0.498521 | 0.00114101 | 18.1948 | 20120011 | 0.00000 | 0.499662 | 18.1366 |