| Red | Green | Blue | |
| z | 17.64 | ||
| znorm | Inf | ||
| sky | -Inf | -Inf | -NaN |
| S/N | 19.9 | 34.6 | 42.4 |
| S/N(c) | 0.0 | 0.0 | 0.0 |
| SN(E/C) |
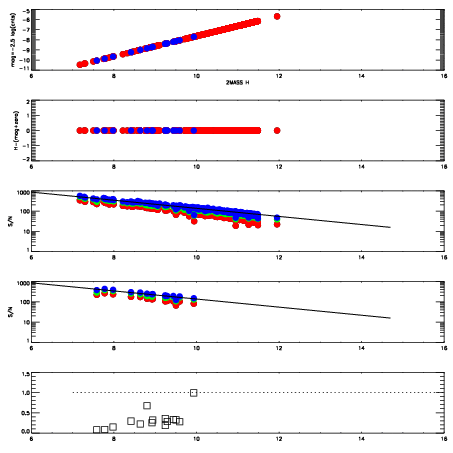
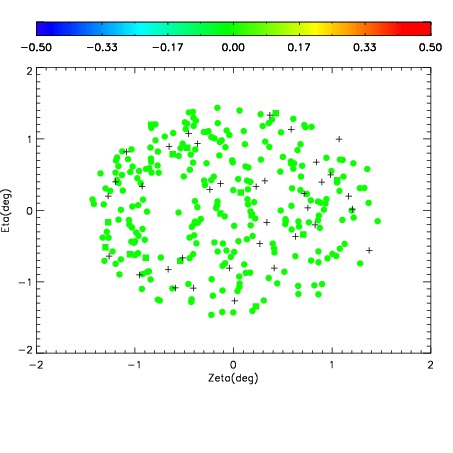
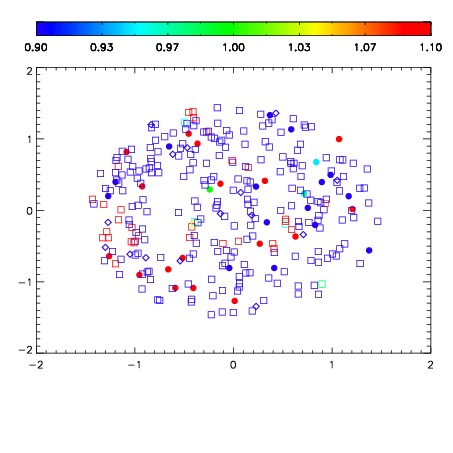
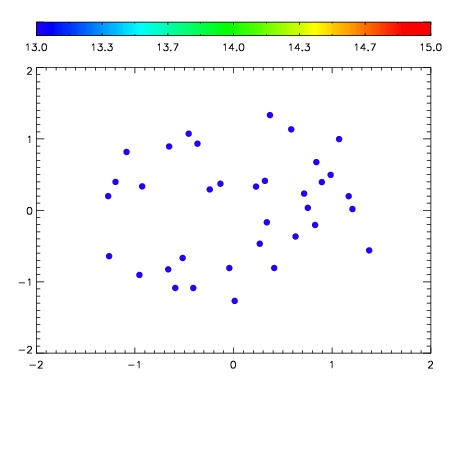

| Frame | Nreads | Zeropoints | Mag plots | Spatial mag deviation | Spatial sky 16325A emission deviations (filled: sky, open: star) | Spatial sky continuum emission | Spatial sky telluric CO2 absorption deviations (filled: H < 10) | |||||||||||||||||||||||
| 0 | 0 |
|
|
|
|
|
|
| IPAIR | NAME | SHIFT | NEWSHIFT | S/N | NAME | SHIFT | NEWSHIFT | S/N |
| 0 | 19500047 | 0.491595 | 0.00000 | 18.2195 | 19500046 | -0.000674503 | 0.492270 | 18.1648 |
| 1 | 19500044 | 0.488752 | 0.00284299 | 18.3961 | 19500045 | -0.000863912 | 0.492459 | 18.5014 |
| 2 | 19500043 | 0.488496 | 0.00309899 | 18.3700 | 19500042 | 0.00200632 | 0.489589 | 18.4430 |
| 3 | 19500048 | 0.490852 | 0.000743002 | 18.2976 | 19500049 | -0.000108503 | 0.491704 | 18.2194 |
| 4 | 19500040 | 0.488980 | 0.00261500 | 18.1253 | 19500041 | 0.00188143 | 0.489714 | 18.1607 |
| 5 | 19500039 | 0.487607 | 0.00398800 | 18.0688 | 19500038 | 0.00000 | 0.491595 | 18.0663 |