| Red | Green | Blue | |
| z | 17.64 | ||
| znorm | Inf | ||
| sky | -Inf | -Inf | -NaN |
| S/N | 20.9 | 36.1 | 44.3 |
| S/N(c) | 0.0 | 0.0 | 0.0 |
| SN(E/C) |
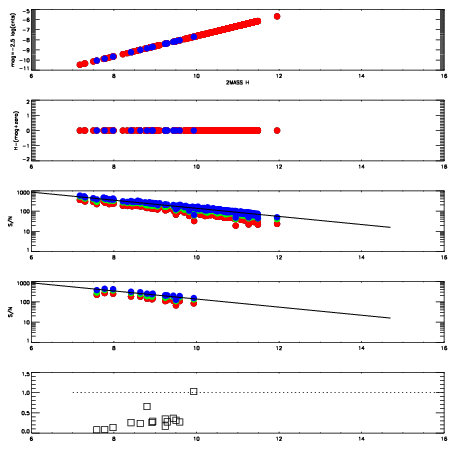
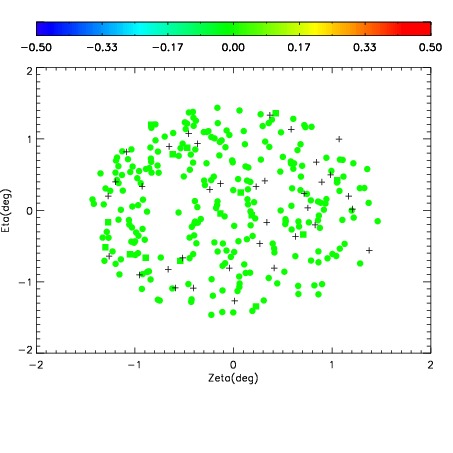
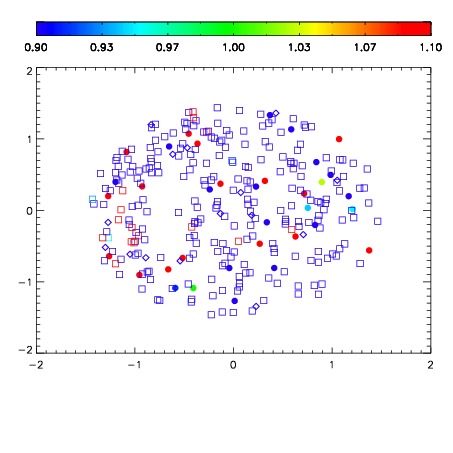


| Frame | Nreads | Zeropoints | Mag plots | Spatial mag deviation | Spatial sky 16325A emission deviations (filled: sky, open: star) | Spatial sky continuum emission | Spatial sky telluric CO2 absorption deviations (filled: H < 10) | |||||||||||||||||||||||
| 0 | 0 |
|
|
|
|
|
|
| IPAIR | NAME | SHIFT | NEWSHIFT | S/N | NAME | SHIFT | NEWSHIFT | S/N |
| 0 | 19510047 | 0.489513 | 0.00000 | 18.4594 | 19510046 | -0.00122078 | 0.490734 | 18.3940 |
| 1 | 19510043 | 0.486715 | 0.00279802 | 18.5090 | 19510042 | 0.000996709 | 0.488516 | 18.4835 |
| 2 | 19510048 | 0.487664 | 0.00184900 | 18.3434 | 19510045 | -0.000988526 | 0.490502 | 18.3766 |
| 3 | 19510044 | 0.486743 | 0.00277001 | 18.3198 | 19510049 | -0.00274540 | 0.492258 | 18.3281 |
| 4 | 19510040 | 0.487839 | 0.00167400 | 18.2394 | 19510041 | 0.00199192 | 0.487521 | 18.2744 |
| 5 | 19510039 | 0.487469 | 0.00204402 | 18.1815 | 19510038 | 0.00000 | 0.489513 | 18.1002 |