| Red | Green | Blue | |
| z | 17.64 | ||
| znorm | Inf | ||
| sky | -Inf | -NaN | -NaN |
| S/N | 29.2 | 46.6 | 55.0 |
| S/N(c) | 0.0 | 0.0 | 0.0 |
| SN(E/C) |
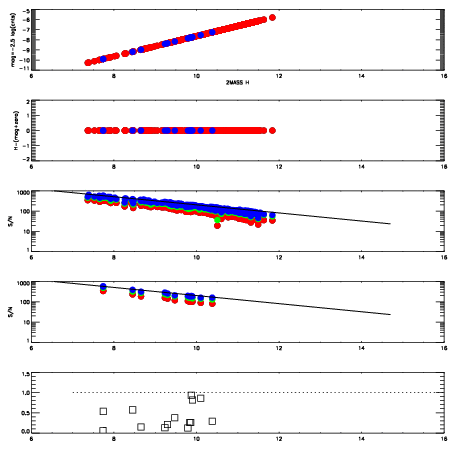
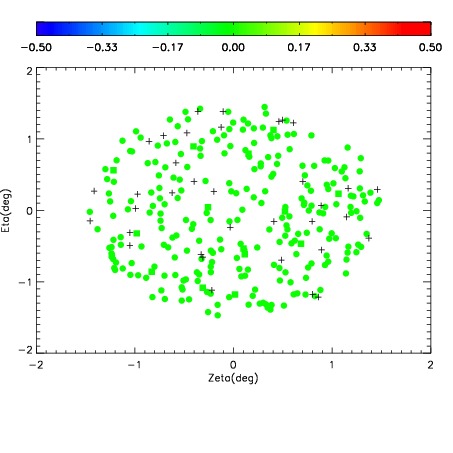
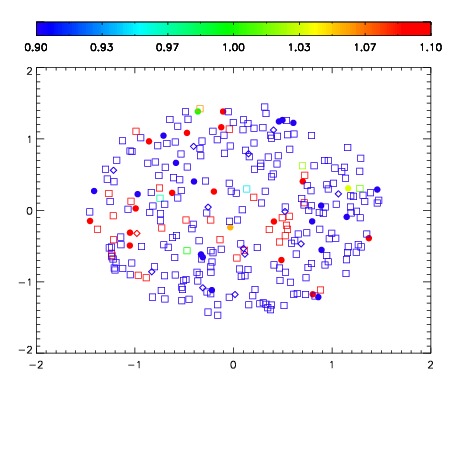


| Frame | Nreads | Zeropoints | Mag plots | Spatial mag deviation | Spatial sky 16325A emission deviations (filled: sky, open: star) | Spatial sky continuum emission | Spatial sky telluric CO2 absorption deviations (filled: H < 10) | |||||||||||||||||||||||
| 0 | 0 |
|
|
|
|
|
|
| IPAIR | NAME | SHIFT | NEWSHIFT | S/N | NAME | SHIFT | NEWSHIFT | S/N |
| 0 | 20180025 | 0.501737 | 0.00000 | 17.2573 | 20180034 | 0.00123096 | 0.500506 | 17.0339 |
| 1 | 20180013 | 0.491711 | 0.0100260 | 18.9427 | 20180035 | 0.000519483 | 0.501218 | 18.4473 |
| 2 | 20180036 | 0.497052 | 0.00468498 | 18.5541 | 20180015 | -0.00204503 | 0.503782 | 18.3068 |
| 3 | 20180029 | 0.499594 | 0.00214300 | 18.2956 | 20180018 | -0.00337857 | 0.505116 | 18.2562 |
| 4 | 20180016 | 0.493276 | 0.00846100 | 18.2572 | 20180022 | -0.00227622 | 0.504013 | 18.2302 |
| 5 | 20180020 | 0.496127 | 0.00560999 | 18.2004 | 20180014 | -0.00145064 | 0.503188 | 18.1032 |
| 6 | 20180017 | 0.494932 | 0.00680500 | 18.1935 | 20180011 | 0.00000 | 0.501737 | 17.8790 |
| 7 | 20180028 | 0.498279 | 0.00345799 | 18.1838 | 20180023 | -0.000867923 | 0.502605 | 17.7861 |
| 8 | 20180024 | 0.500658 | 0.00107902 | 18.1424 | 20180027 | -0.00161215 | 0.503349 | 17.5738 |
| 9 | 20180033 | 0.497869 | 0.00386798 | 18.0849 | 20180031 | 0.00119456 | 0.500542 | 17.5248 |
| 10 | 20180032 | 0.498051 | 0.00368601 | 17.8809 | 20180030 | 0.000428334 | 0.501309 | 17.3808 |
| 11 | 20180021 | 0.498021 | 0.00371599 | 17.7344 | 20180019 | -0.00251761 | 0.504255 | 17.3287 |
| 12 | 20180012 | 0.492542 | 0.00919500 | 17.6306 | 20180026 | -1.78514e-05 | 0.501755 | 17.2407 |