| Red | Green | Blue | |
| z | 17.64 | ||
| znorm | Inf | ||
| sky | -NaN | -Inf | -NaN |
| S/N | 34.9 | 52.4 | 64.6 |
| S/N(c) | 41.5 | 36.1 | 72.5 |
| SN(E/C) |
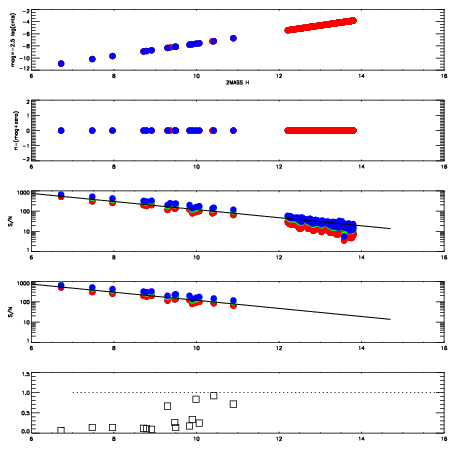


| Frame | Nreads | Zeropoints | Mag plots | Spatial mag deviation | Spatial sky 16325A emission deviations (filled: sky, open: star) | Spatial sky continuum emission | Spatial sky telluric CO2 absorption deviations (filled: H < 10) | |||||||||||||||||||||||
| 0 | 0 |
|
|
|
|
|
|
| IPAIR | NAME | SHIFT | NEWSHIFT | S/N | NAME | SHIFT | NEWSHIFT | S/N |
| 0 | 19900016 | 0.497697 | 0.00000 | 19.1162 | 19900017 | 0.00250948 | 0.495188 | 19.1763 |
| 1 | 19900012 | 0.496411 | 0.00128600 | 19.1104 | 19900013 | -1.50165e-05 | 0.497712 | 19.0941 |
| 2 | 19900011 | 0.495692 | 0.00200498 | 19.0803 | 19900010 | 0.00000 | 0.497697 | 19.0897 |
| 3 | 19900015 | 0.497053 | 0.000643998 | 19.0737 | 19900014 | 0.000159553 | 0.497537 | 19.0022 |