| Red | Green | Blue | |
| z | 17.64 | ||
| znorm | Inf | ||
| sky | -Inf | -Inf | -NaN |
| S/N | 36.6 | 56.0 | 69.0 |
| S/N(c) | 43.1 | 39.1 | 80.9 |
| SN(E/C) |

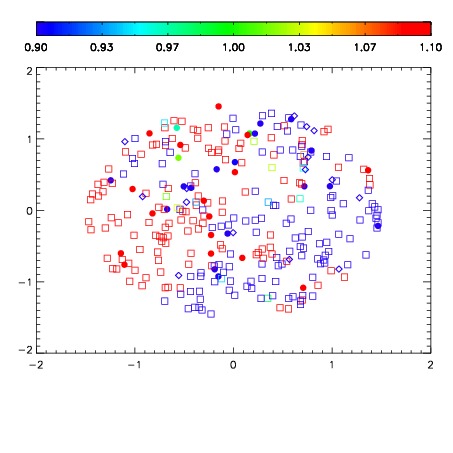


| Frame | Nreads | Zeropoints | Mag plots | Spatial mag deviation | Spatial sky 16325A emission deviations (filled: sky, open: star) | Spatial sky continuum emission | Spatial sky telluric CO2 absorption deviations (filled: H < 10) | |||||||||||||||||||||||
| 0 | 0 |
|
|
|
|
|
|
| IPAIR | NAME | SHIFT | NEWSHIFT | S/N | NAME | SHIFT | NEWSHIFT | S/N |
| 0 | 19920017 | 0.497736 | 0.00000 | 19.1348 | 19920015 | -0.00284717 | 0.500583 | 19.1315 |
| 1 | 19920016 | 0.497022 | 0.000714004 | 19.1352 | 19920018 | 0.00304205 | 0.494694 | 19.1516 |
| 2 | 19920013 | 0.496128 | 0.00160801 | 19.1100 | 19920014 | -0.00306842 | 0.500804 | 19.1196 |
| 3 | 19920012 | 0.495055 | 0.00268102 | 19.1041 | 19920011 | 0.00000 | 0.497736 | 19.0434 |