| Red | Green | Blue | |
| z | 17.64 | ||
| znorm | Inf | ||
| sky | -Inf | -Inf | -NaN |
| S/N | 35.0 | 51.1 | 64.1 |
| S/N(c) | 42.7 | 38.0 | 78.2 |
| SN(E/C) |
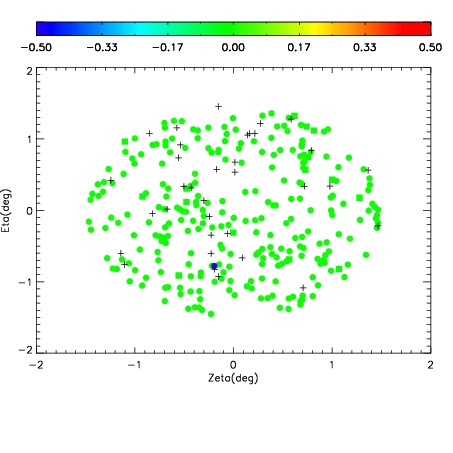
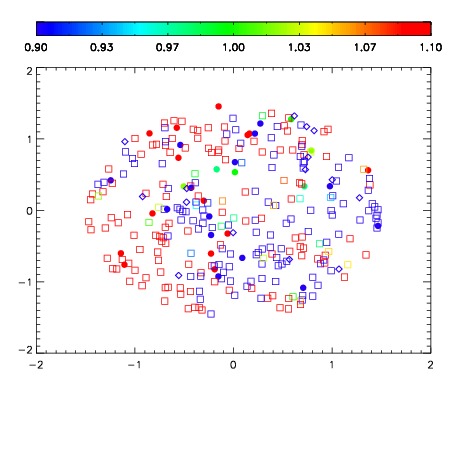


| Frame | Nreads | Zeropoints | Mag plots | Spatial mag deviation | Spatial sky 16325A emission deviations (filled: sky, open: star) | Spatial sky continuum emission | Spatial sky telluric CO2 absorption deviations (filled: H < 10) | |||||||||||||||||||||||
| 0 | 0 |
|
|
|
|
|
|
| IPAIR | NAME | SHIFT | NEWSHIFT | S/N | NAME | SHIFT | NEWSHIFT | S/N |
| 0 | 19940013 | 0.492428 | 0.00000 | 19.0516 | 19940011 | 0.00000 | 0.492428 | 19.0385 |
| 1 | 19940017 | 0.491606 | 0.000822008 | 19.1074 | 19940018 | -0.000908405 | 0.493336 | 19.1015 |
| 2 | 19940016 | 0.490867 | 0.00156102 | 19.0867 | 19940014 | -0.00321571 | 0.495644 | 19.0856 |
| 3 | 19940012 | 0.491895 | 0.000533015 | 19.0582 | 19940015 | -0.00337988 | 0.495808 | 19.0833 |