| Frame | Nreads | Zeropoints | Mag plots
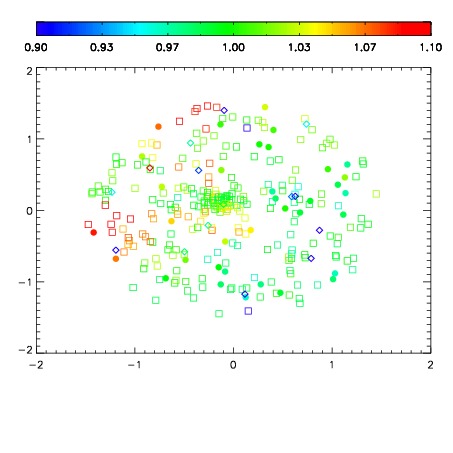
| Spatial mag deviation
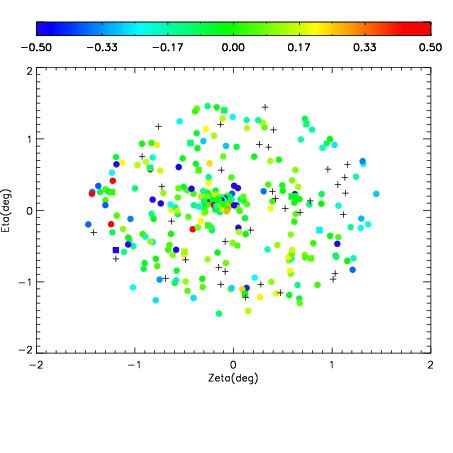
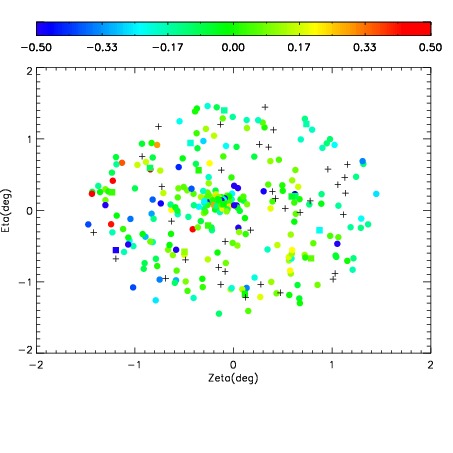
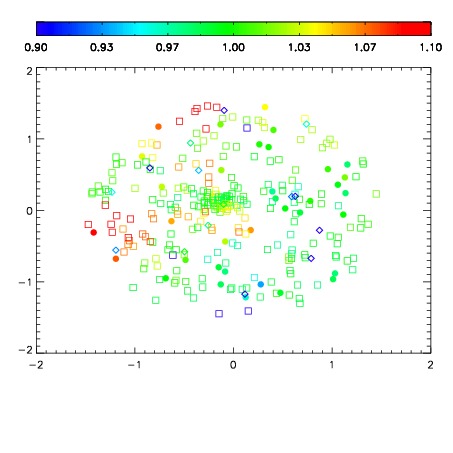
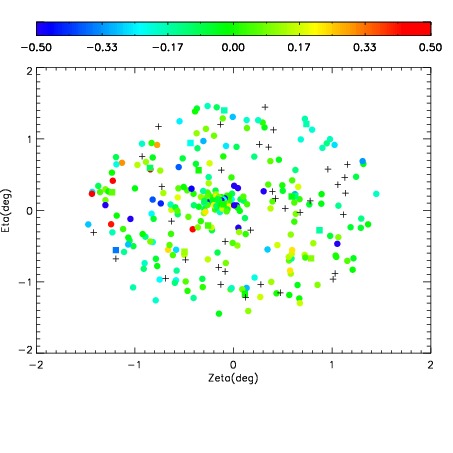
| Spatial sky 16325A emission deviations (filled: sky, open: star)
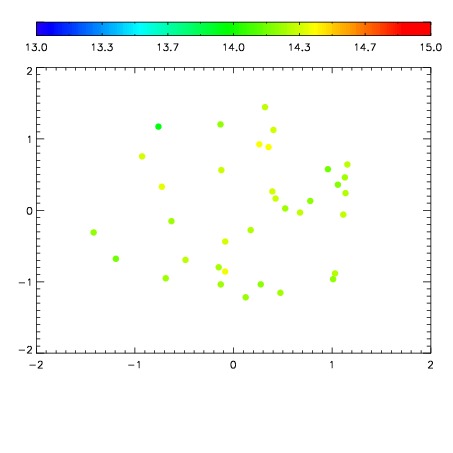
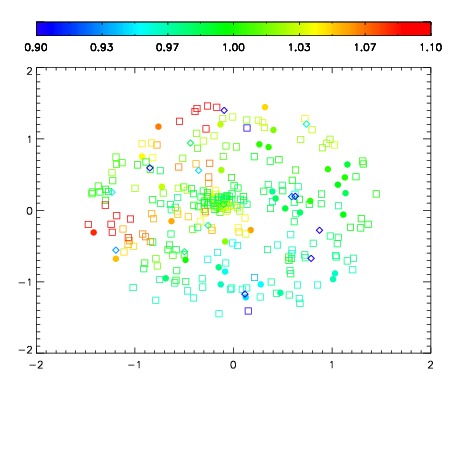
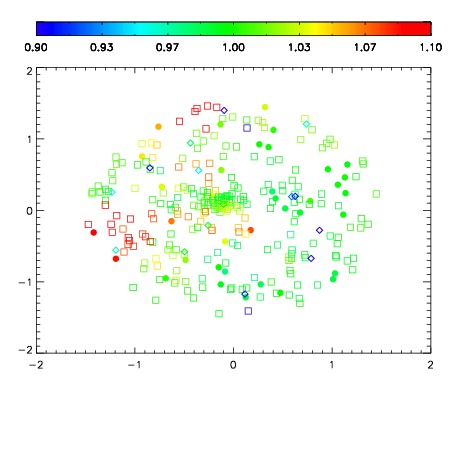
| Spatial sky continuum emission
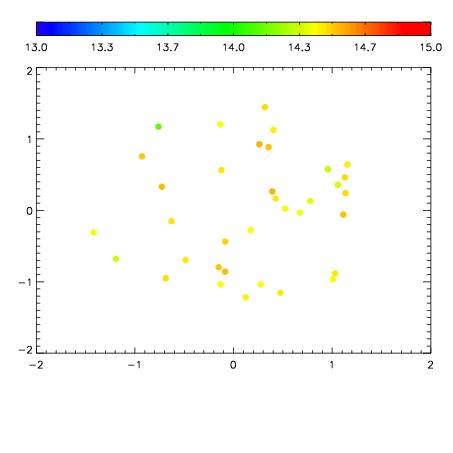
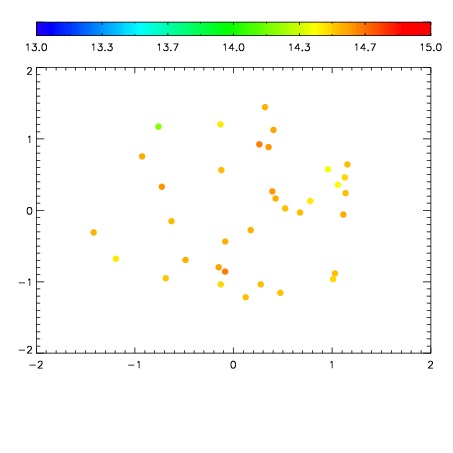
| Spatial sky telluric CO2 absorption deviations (filled: H < 10)
|
| 19910022
| 94
| | Red | Green | Blue
| | z | | 19.76
| | znorm | | 14.83
| | sky | 14.5 | 14.3 | 14.3
| | S/N | 26.8 | 36.7 | 43.9
| | S/N(c) | 22.3 | 44.8 | 19.5
| | SN(E/C) 0.68
|
| 
| 
| 
| 
| 
|
| 19910023
| 94
| | Red | Green | Blue
| | z | | 19.70
| | znorm | | 14.77
| | sky | 14.5 | 14.4 | 14.4
| | S/N | 25.8 | 35.3 | 42.6
| | S/N(c) | 21.7 | 43.8 | 18.7
| | SN(E/C) 0.68
|
| 
| 
| 
| 
| 
|
| 19910024
| 94
| | Red | Green | Blue
| | z | | 19.75
| | znorm | | 14.82
| | sky | 14.6 | 14.5 | 14.3
| | S/N | 26.4 | 36.3 | 43.9
| | S/N(c) | 22.2 | 45.1 | 19.2
| | SN(E/C) 0.67
|
| 
| 
| 
| 
| 
|
| 19910025
| 94
| | Red | Green | Blue
| | z | | 19.48
| | znorm | | 14.54
| | sky | 14.6 | 14.5 | 14.4
| | S/N | 23.3 | 31.9 | 38.8
| | S/N(c) | 19.7 | 41.9 | 25.2
| | SN(E/C) 0.74
|
| 
| 
| 
| 
| 
|