| Red | Green | Blue | |
| z | 17.64 | ||
| znorm | Inf | ||
| sky | -Inf | -NaN | -NaN |
| S/N | 34.3 | 47.9 | 58.5 |
| S/N(c) | 30.4 | 62.0 | 26.3 |
| SN(E/C) |

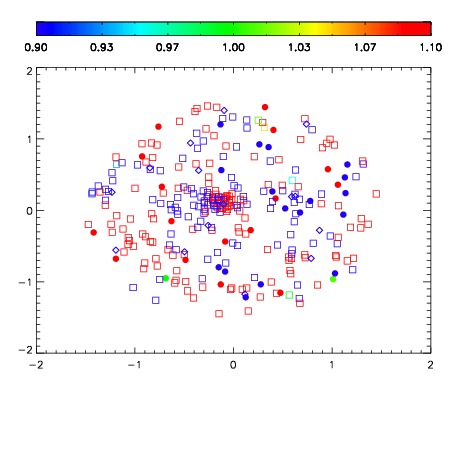
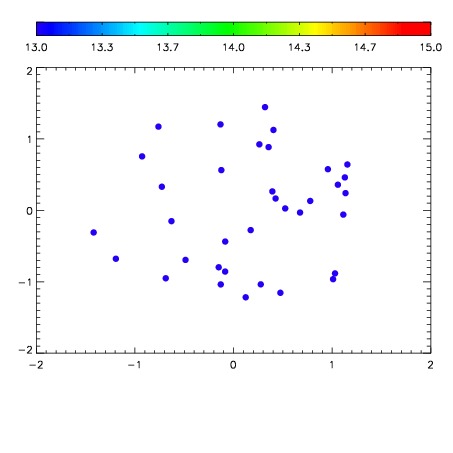

| Frame | Nreads | Zeropoints | Mag plots | Spatial mag deviation | Spatial sky 16325A emission deviations (filled: sky, open: star) | Spatial sky continuum emission | Spatial sky telluric CO2 absorption deviations (filled: H < 10) | |||||||||||||||||||||||
| 0 | 0 |
|
|
|
|
|
|
| IPAIR | NAME | SHIFT | NEWSHIFT | S/N | NAME | SHIFT | NEWSHIFT | S/N |
| 0 | 19910024 | 0.498269 | 0.00000 | 19.7489 | 19910022 | 0.00000 | 0.498269 | 19.8017 |
| 1 | 19910023 | 0.496630 | 0.00163898 | 19.7009 | 19910025 | 0.00448787 | 0.493781 | 19.4824 |