| Red | Green | Blue | |
| z | 17.64 | ||
| znorm | Inf | ||
| sky | -NaN | -NaN | -Inf |
| S/N | 38.7 | 53.0 | 65.1 |
| S/N(c) | 64.1 | 39.7 | 56.8 |
| SN(E/C) |
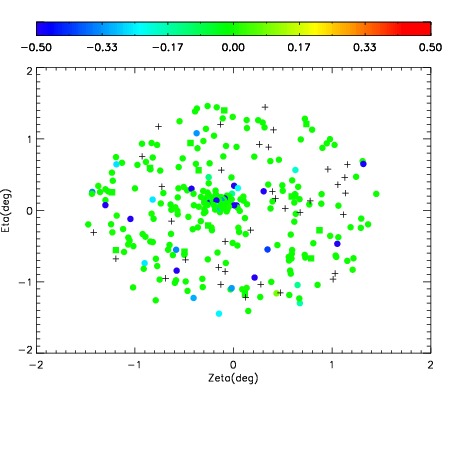
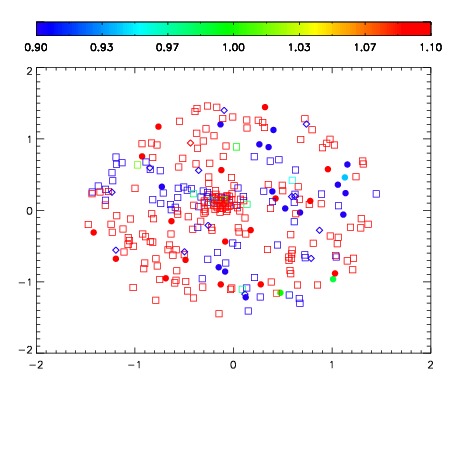
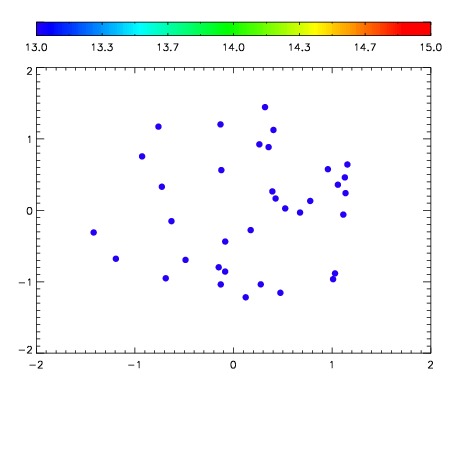

| Frame | Nreads | Zeropoints | Mag plots | Spatial mag deviation | Spatial sky 16325A emission deviations (filled: sky, open: star) | Spatial sky continuum emission | Spatial sky telluric CO2 absorption deviations (filled: H < 10) | |||||||||||||||||||||||
| 0 | 0 |
|
|
|
|
|
|
| IPAIR | NAME | SHIFT | NEWSHIFT | S/N | NAME | SHIFT | NEWSHIFT | S/N |
| 0 | 19930027 | 0.501131 | 0.00000 | 19.6695 | 19930025 | 0.00000 | 0.501131 | 19.7338 |
| 1 | 19930026 | 0.500235 | 0.000895977 | 19.7408 | 19930028 | 0.00227752 | 0.498853 | 19.7671 |