| Red | Green | Blue | |
| z | 17.64 | ||
| znorm | Inf | ||
| sky | -Inf | -Inf | -NaN |
| S/N | 31.1 | 45.5 | 53.8 |
| S/N(c) | 27.6 | 81.4 | 68.4 |
| SN(E/C) |
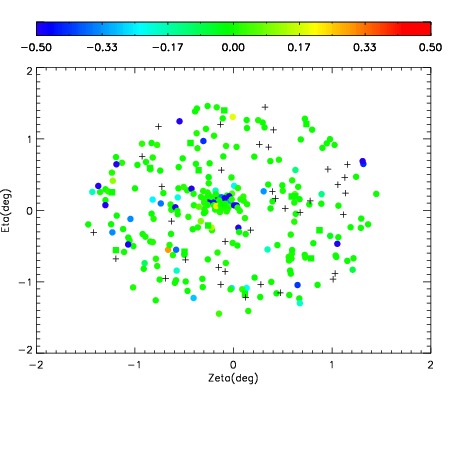

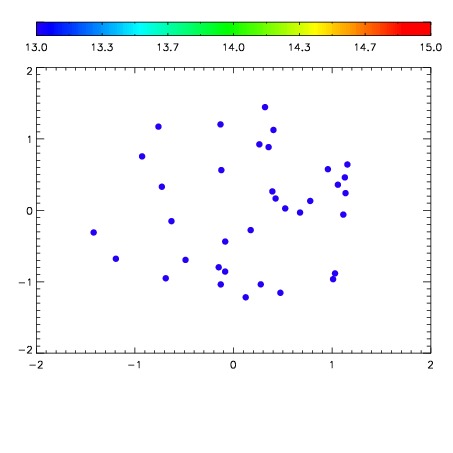

| Frame | Nreads | Zeropoints | Mag plots | Spatial mag deviation | Spatial sky 16325A emission deviations (filled: sky, open: star) | Spatial sky continuum emission | Spatial sky telluric CO2 absorption deviations (filled: H < 10) | |||||||||||||||||||||||
| 0 | 0 |
|
|
|
|
|
|
| IPAIR | NAME | SHIFT | NEWSHIFT | S/N | NAME | SHIFT | NEWSHIFT | S/N |
| 0 | 19960019 | 0.497358 | 0.00000 | 19.5479 | 19960018 | 0.00000 | 0.497358 | 19.5593 |
| 1 | 19960020 | 0.496415 | 0.000943005 | 19.2137 | 19960021 | 0.00105766 | 0.496300 | 19.2254 |