| Frame | Nreads | Zeropoints | Mag plots
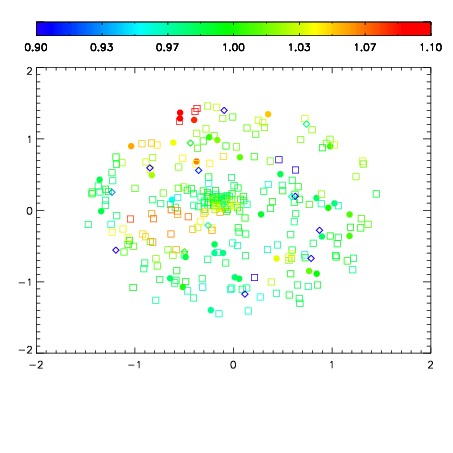
| Spatial mag deviation
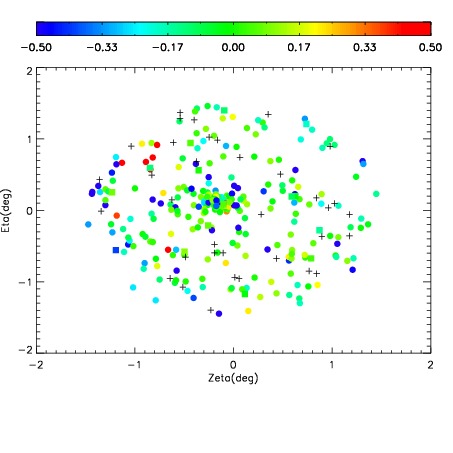
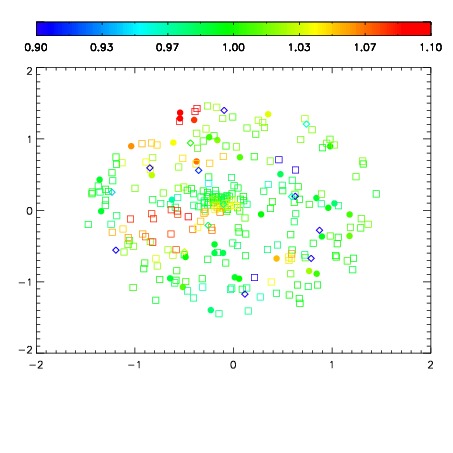
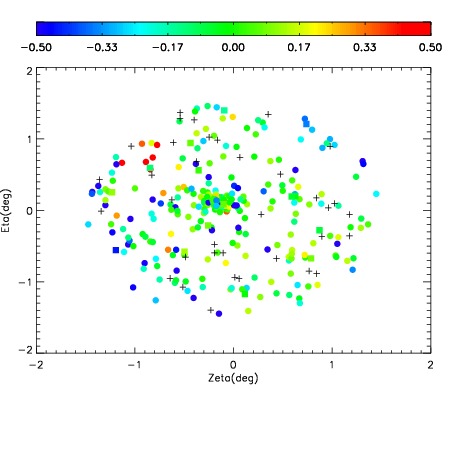
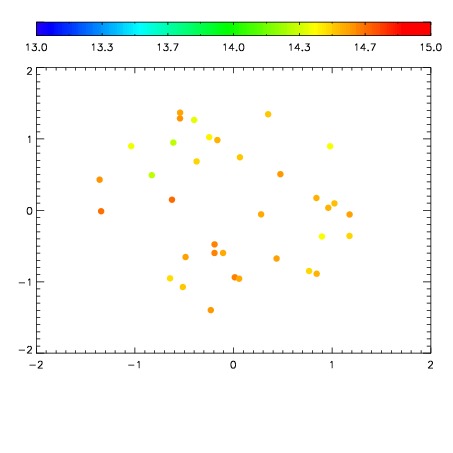
| Spatial sky 16325A emission deviations (filled: sky, open: star)
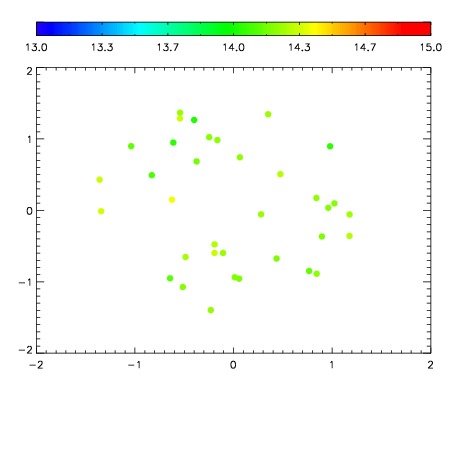
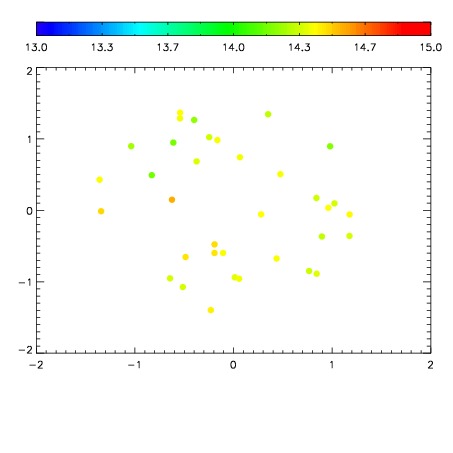
| Spatial sky continuum emission
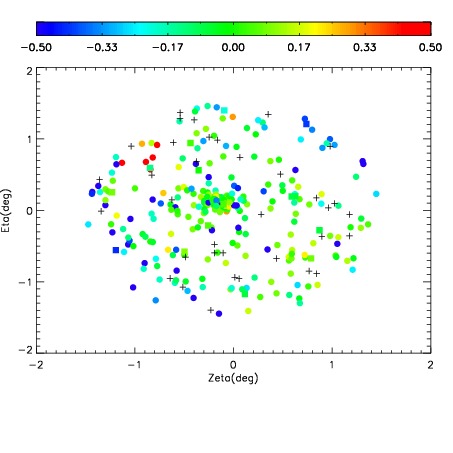
| Spatial sky telluric CO2 absorption deviations (filled: H < 10)
|
| 19920022
| 94
| | Red | Green | Blue
| | z | | 19.83
| | znorm | | 14.90
| | sky | 14.6 | 14.2 | 14.3
| | S/N | 30.0 | 40.2 | 49.8
| | S/N(c) | 16.5 | 45.8 | 12.1
| | SN(E/C) 0.62
|
| 
| 
| 
| 
| 
|
| 19920023
| 94
| | Red | Green | Blue
| | z | | 19.87
| | znorm | | 14.93
| | sky | 14.5 | 14.5 | 14.4
| | S/N | 29.9 | 40.5 | 49.8
| | S/N(c) | 16.5 | 45.0 | 11.6
| | SN(E/C) 0.65
|
| 
| 
| 
| 
| 
|
| 19920024
| 94
| | Red | Green | Blue
| | z | | 19.84
| | znorm | | 14.91
| | sky | 14.5 | 14.4 | 14.5
| | S/N | 30.1 | 40.7 | 50.1
| | S/N(c) | 16.6 | 45.1 | 11.3
| | SN(E/C) 0.61
|
| 
| 
| 
| 
| 
|
| 19920025
| 94
| | Red | Green | Blue
| | z | | 19.87
| | znorm | | 14.93
| | sky | 14.6 | 14.6 | 14.4
| | S/N | 30.0 | 40.7 | 50.0
| | S/N(c) | 16.6 | 45.1 | 11.1
| | SN(E/C) 0.62
|
| 
| 
| 
| 
| 
|