| Red | Green | Blue | |
| z | 17.64 | ||
| znorm | Inf | ||
| sky | -NaN | -NaN | -NaN |
| S/N | 40.5 | 55.5 | 69.0 |
| S/N(c) | 23.4 | 63.7 | 16.3 |
| SN(E/C) |
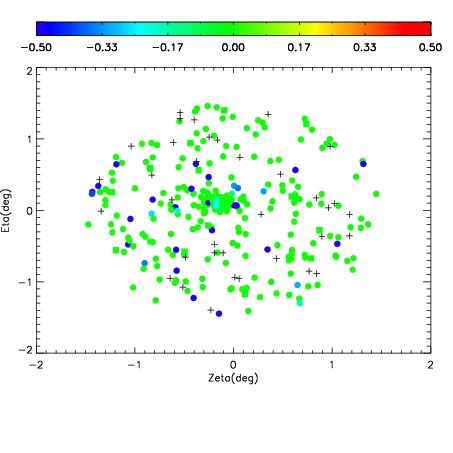
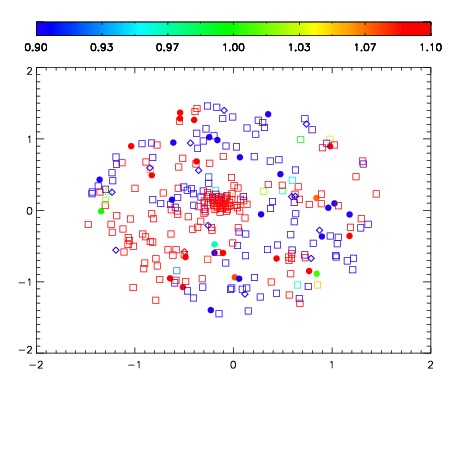
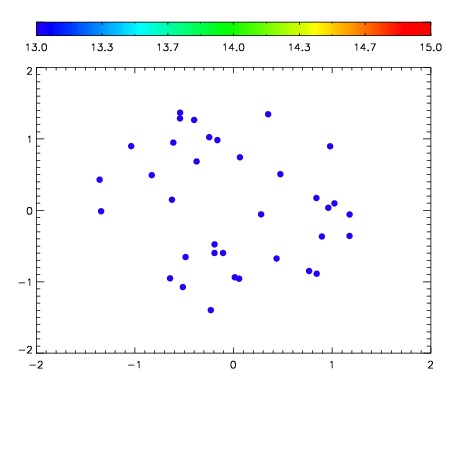

| Frame | Nreads | Zeropoints | Mag plots | Spatial mag deviation | Spatial sky 16325A emission deviations (filled: sky, open: star) | Spatial sky continuum emission | Spatial sky telluric CO2 absorption deviations (filled: H < 10) | |||||||||||||||||||||||
| 0 | 0 |
|
|
|
|
|
|
| IPAIR | NAME | SHIFT | NEWSHIFT | S/N | NAME | SHIFT | NEWSHIFT | S/N |
| 0 | 19920024 | 0.499931 | 0.00000 | 19.8467 | 19920022 | 0.00000 | 0.499931 | 19.8527 |
| 1 | 19920023 | 0.498350 | 0.00158101 | 19.8599 | 19920025 | -0.000961107 | 0.500892 | 19.8565 |