| Red | Green | Blue | |
| z | 17.63 | ||
| znorm | Inf | ||
| sky | -NaN | -NaN | -NaN |
| S/N | 48.1 | 69.2 | 81.5 |
| S/N(c) | 38.7 | 105.5 | 20.3 |
| SN(E/C) |
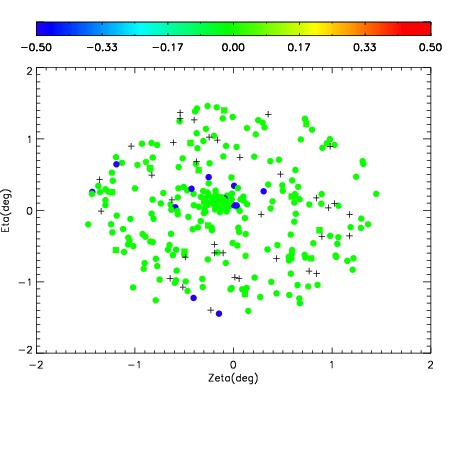
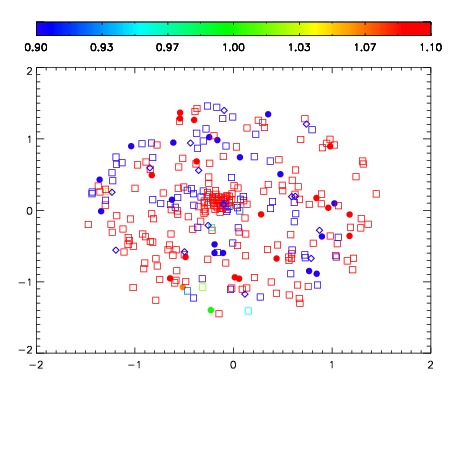


| Frame | Nreads | Zeropoints | Mag plots | Spatial mag deviation | Spatial sky 16325A emission deviations (filled: sky, open: star) | Spatial sky continuum emission | Spatial sky telluric CO2 absorption deviations (filled: H < 10) | |||||||||||||||||||||||
| 0 | 0 |
|
|
|
|
|
|
| IPAIR | NAME | SHIFT | NEWSHIFT | S/N | NAME | SHIFT | NEWSHIFT | S/N |
| 0 | 19950023 | 0.506036 | 0.00000 | 19.8382 | 19950021 | 0.00453338 | 0.501503 | 19.8198 |
| 1 | 19950020 | 0.502825 | 0.00321096 | 19.8224 | 19950022 | 0.00525313 | 0.500783 | 19.7849 |
| 2 | 19950019 | 0.502786 | 0.00325000 | 19.7375 | 19950018 | 0.00000 | 0.506036 | 19.7378 |