| Red | Green | Blue | |
| z | 17.64 | ||
| znorm | Inf | ||
| sky | -NaN | -Inf | -NaN |
| S/N | 25.8 | 44.9 | 50.9 |
| S/N(c) | 0.0 | 0.0 | 0.0 |
| SN(E/C) |
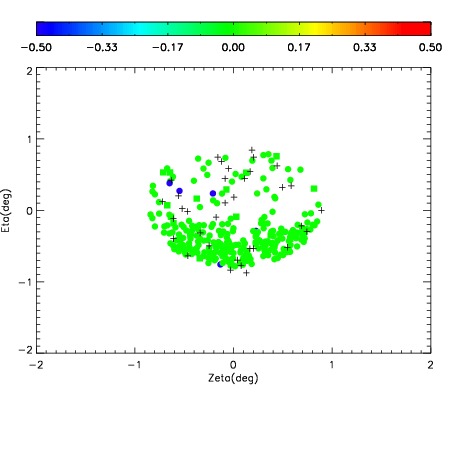
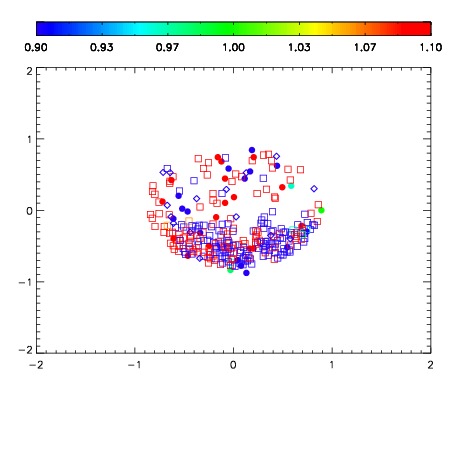
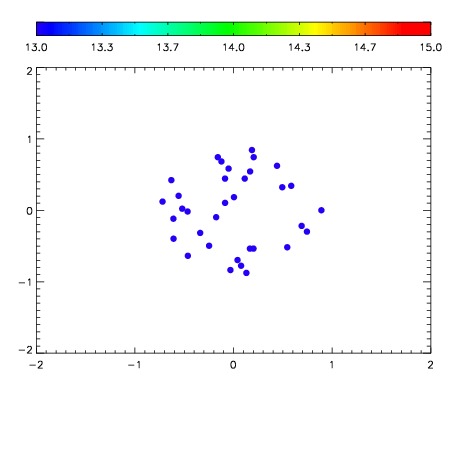

| Frame | Nreads | Zeropoints | Mag plots | Spatial mag deviation | Spatial sky 16325A emission deviations (filled: sky, open: star) | Spatial sky continuum emission | Spatial sky telluric CO2 absorption deviations (filled: H < 10) | |||||||||||||||||||||||
| 0 | 0 |
|
|
|
|
|
|
| IPAIR | NAME | SHIFT | NEWSHIFT | S/N | NAME | SHIFT | NEWSHIFT | S/N |
| 0 | 19920053 | 0.00373697 | 0.00000 | 19.1308 | 19920050 | -0.491067 | 0.494804 | 19.1867 |
| 1 | 19920049 | 0.00000 | 0.00373697 | 19.1289 | 19920051 | -0.490710 | 0.494447 | 19.1576 |
| 2 | 19920052 | 0.00228521 | 0.00145176 | 19.0841 | 19920054 | -0.492091 | 0.495828 | 19.1173 |