| Red | Green | Blue | |
| z | 17.64 | ||
| znorm | Inf | ||
| sky | -Inf | -Inf | -Inf |
| S/N | 20.5 | 38.4 | 42.5 |
| S/N(c) | 0.0 | 0.0 | 0.0 |
| SN(E/C) |

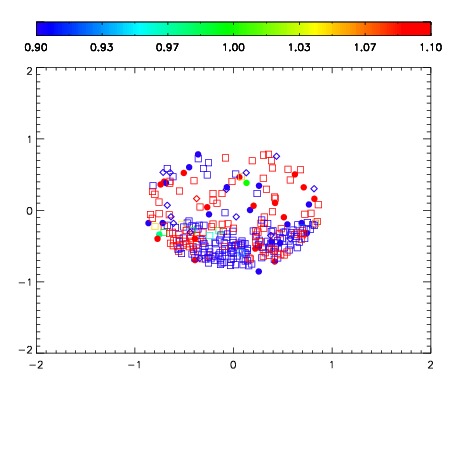
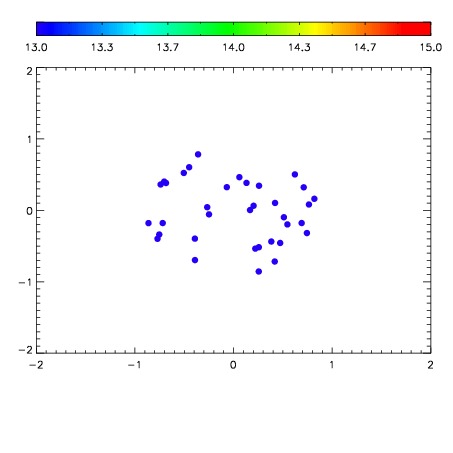

| Frame | Nreads | Zeropoints | Mag plots | Spatial mag deviation | Spatial sky 16325A emission deviations (filled: sky, open: star) | Spatial sky continuum emission | Spatial sky telluric CO2 absorption deviations (filled: H < 10) | |||||||||||||||||||||||
| 0 | 0 |
|
|
|
|
|
|
| IPAIR | NAME | SHIFT | NEWSHIFT | S/N | NAME | SHIFT | NEWSHIFT | S/N |
| 0 | 19960041 | 0.00294594 | 0.00000 | 18.6109 | 19960042 | -0.487187 | 0.490133 | 18.6269 |
| 1 | 19960044 | 0.000254041 | 0.00269190 | 18.7787 | 19960039 | -0.487234 | 0.490180 | 18.7303 |
| 2 | 19960037 | 0.00000 | 0.00294594 | 18.6542 | 19960043 | -0.488275 | 0.491221 | 18.6650 |
| 3 | 19960040 | 0.00185993 | 0.00108601 | 18.6359 | 19960038 | -0.487727 | 0.490673 | 18.6526 |