| Red | Green | Blue | |
| z | 17.64 | ||
| znorm | Inf | ||
| sky | -Inf | -Inf | -NaN |
| S/N | 29.1 | 50.5 | 56.3 |
| S/N(c) | 0.0 | 0.0 | 0.0 |
| SN(E/C) |
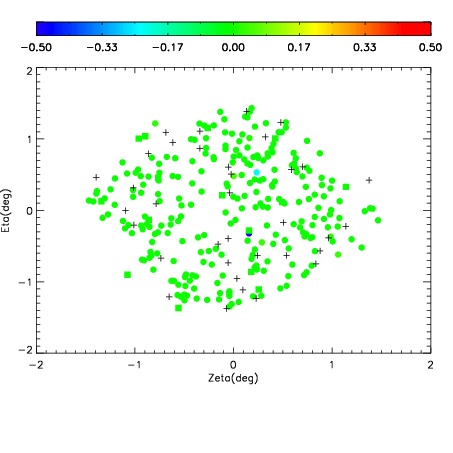
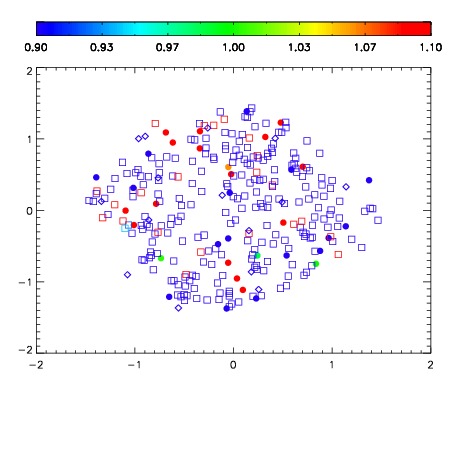
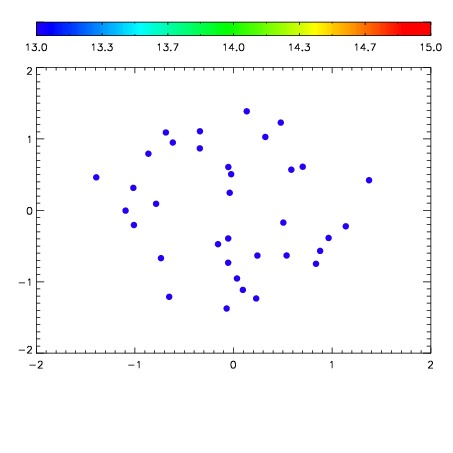

| Frame | Nreads | Zeropoints | Mag plots | Spatial mag deviation | Spatial sky 16325A emission deviations (filled: sky, open: star) | Spatial sky continuum emission | Spatial sky telluric CO2 absorption deviations (filled: H < 10) | |||||||||||||||||||||||
| 0 | 0 |
|
|
|
|
|
|
| IPAIR | NAME | SHIFT | NEWSHIFT | S/N | NAME | SHIFT | NEWSHIFT | S/N |
| 0 | 19910046 | 0.497000 | 0.00000 | 18.9276 | 19910040 | 0.00000 | 0.497000 | 18.8735 |
| 1 | 19910045 | 0.495716 | 0.00128400 | 19.0206 | 19910043 | -0.000754660 | 0.497755 | 18.9938 |
| 2 | 19910042 | 0.495499 | 0.00150099 | 18.9881 | 19910044 | -0.000918521 | 0.497919 | 18.9767 |
| 3 | 19910041 | 0.495363 | 0.00163701 | 18.9346 | 19910047 | -0.00311609 | 0.500116 | 18.9233 |