| Red | Green | Blue | |
| z | 17.64 | ||
| znorm | Inf | ||
| sky | -Inf | -Inf | -NaN |
| S/N | 17.9 | 31.3 | 35.5 |
| S/N(c) | 0.0 | 0.0 | 0.0 |
| SN(E/C) |
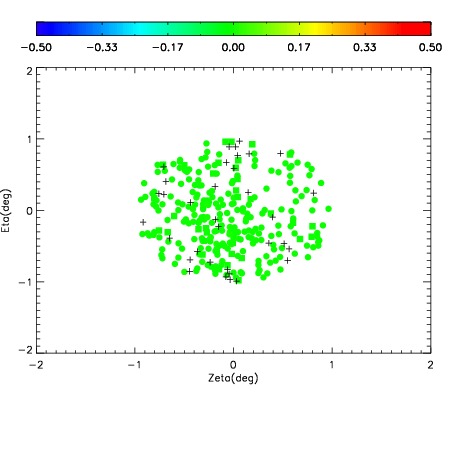
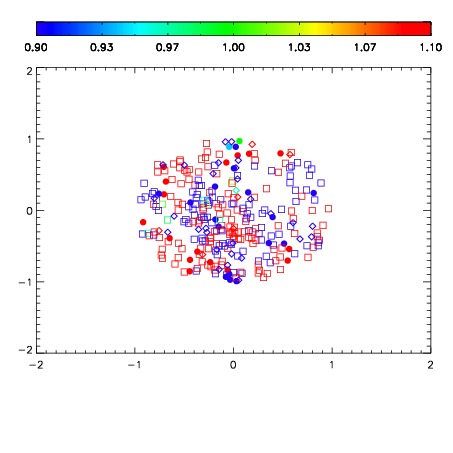
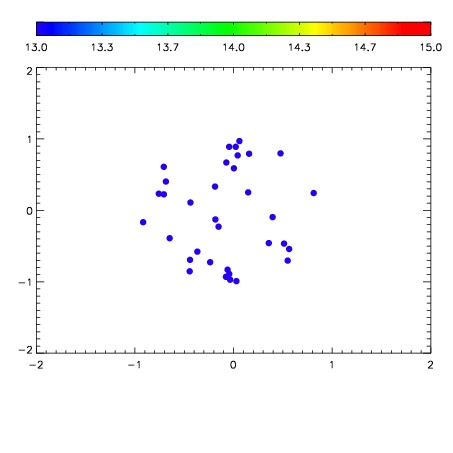

| Frame | Nreads | Zeropoints | Mag plots | Spatial mag deviation | Spatial sky 16325A emission deviations (filled: sky, open: star) | Spatial sky continuum emission | Spatial sky telluric CO2 absorption deviations (filled: H < 10) | |||||||||||||||||||||||
| 0 | 0 |
|
|
|
|
|
|
| IPAIR | NAME | SHIFT | NEWSHIFT | S/N | NAME | SHIFT | NEWSHIFT | S/N |
| 0 | 19940031 | 0.00496630 | 0.00000 | 18.5497 | 19940032 | -0.485753 | 0.490719 | 18.4580 |
| 1 | 19940027 | 0.00000 | 0.00496630 | 18.8544 | 19940028 | -0.488021 | 0.492987 | 18.8909 |
| 2 | 19940030 | 0.00396926 | 0.000997040 | 18.6478 | 19940029 | -0.487708 | 0.492674 | 18.7574 |