| Red | Green | Blue | |
| z | 17.64 | ||
| znorm | Inf | ||
| sky | -Inf | -Inf | -Inf |
| S/N | 25.7 | 45.6 | 48.8 |
| S/N(c) | 0.0 | 0.0 | 0.0 |
| SN(E/C) |
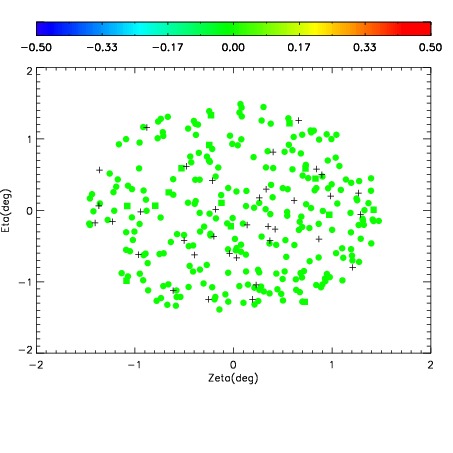
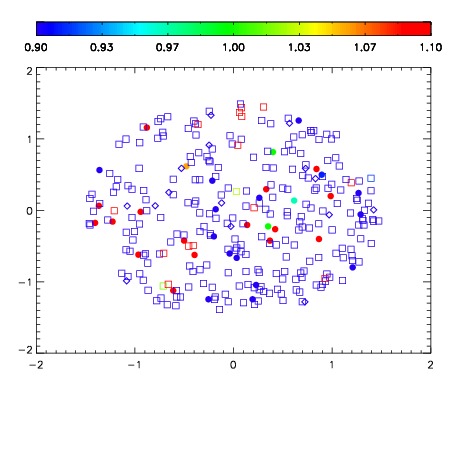
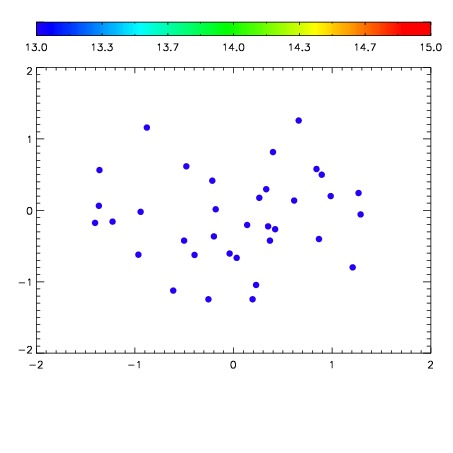

| Frame | Nreads | Zeropoints | Mag plots | Spatial mag deviation | Spatial sky 16325A emission deviations (filled: sky, open: star) | Spatial sky continuum emission | Spatial sky telluric CO2 absorption deviations (filled: H < 10) | |||||||||||||||||||||||
| 0 | 0 |
|
|
|
|
|
|
| IPAIR | NAME | SHIFT | NEWSHIFT | S/N | NAME | SHIFT | NEWSHIFT | S/N |
| 0 | 19890024 | 0.496433 | 0.00000 | 18.2459 | 19890019 | 0.00000 | 0.496433 | 18.3225 |
| 1 | 19890028 | 0.495315 | 0.00111800 | 18.5961 | 19890027 | -0.00333547 | 0.499768 | 18.5561 |
| 2 | 19890021 | 0.496307 | 0.000126004 | 18.4910 | 19890026 | -0.00326194 | 0.499695 | 18.4956 |
| 3 | 19890025 | 0.495889 | 0.000543982 | 18.4615 | 19890022 | 0.000712808 | 0.495720 | 18.4633 |
| 4 | 19890020 | 0.495783 | 0.000649989 | 18.4022 | 19890023 | 0.00104071 | 0.495392 | 18.3474 |
| 5 | 19890029 | 0.495738 | 0.000694990 | 18.1569 | 19890030 | -0.00118962 | 0.497623 | 17.9949 |