| Red | Green | Blue | |
| z | 17.64 | ||
| znorm | Inf | ||
| sky | -Inf | -Inf | -Inf |
| S/N | 17.2 | 30.7 | 32.8 |
| S/N(c) | 0.0 | 0.0 | 0.0 |
| SN(E/C) |
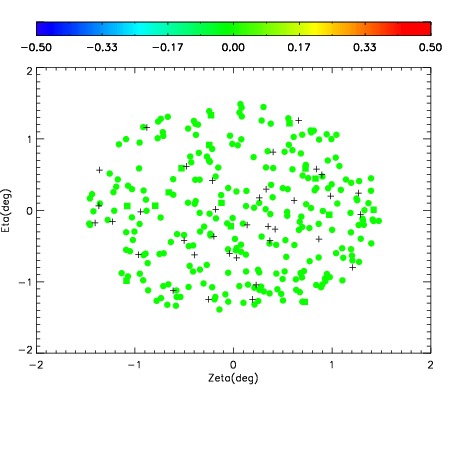
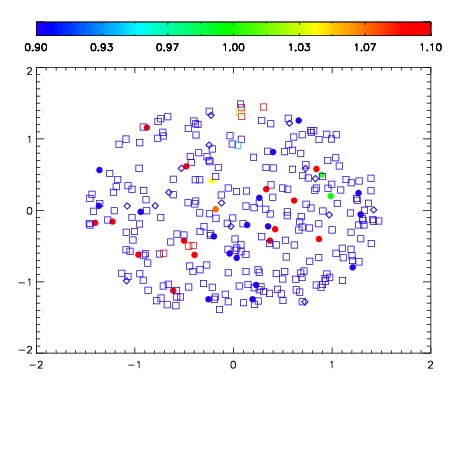


| Frame | Nreads | Zeropoints | Mag plots | Spatial mag deviation | Spatial sky 16325A emission deviations (filled: sky, open: star) | Spatial sky continuum emission | Spatial sky telluric CO2 absorption deviations (filled: H < 10) | |||||||||||||||||||||||
| 0 | 0 |
|
|
|
|
|
|
| IPAIR | NAME | SHIFT | NEWSHIFT | S/N | NAME | SHIFT | NEWSHIFT | S/N |
| 0 | 19900058 | 0.501725 | 0.00000 | 18.0510 | 19900057 | -0.00130331 | 0.503028 | 18.1204 |
| 1 | 19900055 | 0.500759 | 0.000966012 | 18.4584 | 19900056 | -0.00190459 | 0.503630 | 18.4908 |
| 2 | 19900054 | 0.499597 | 0.00212801 | 18.4431 | 19900053 | 0.00000 | 0.501725 | 18.1809 |