| Red | Green | Blue | |
| z | 17.64 | ||
| znorm | Inf | ||
| sky | -Inf | -NaN | -NaN |
| S/N | 25.0 | 40.5 | 43.6 |
| S/N(c) | 0.0 | 0.0 | 0.0 |
| SN(E/C) |
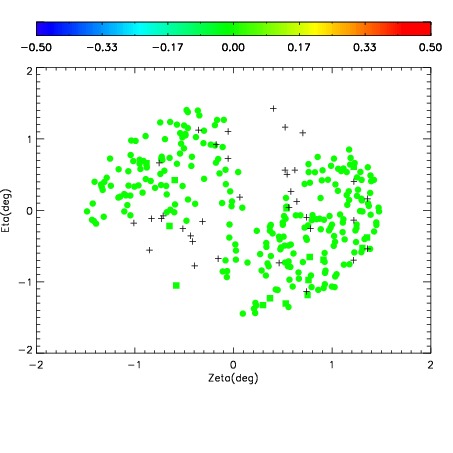
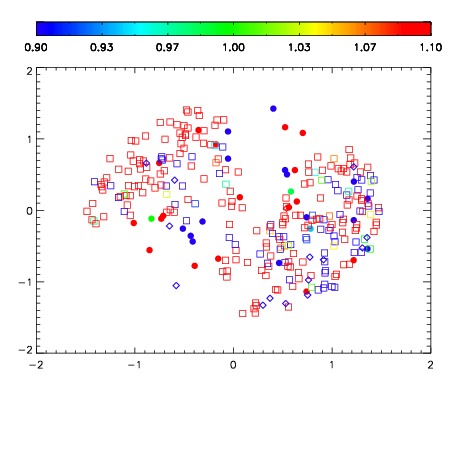


| Frame | Nreads | Zeropoints | Mag plots | Spatial mag deviation | Spatial sky 16325A emission deviations (filled: sky, open: star) | Spatial sky continuum emission | Spatial sky telluric CO2 absorption deviations (filled: H < 10) | |||||||||||||||||||||||
| 0 | 0 |
|
|
|
|
|
|
| IPAIR | NAME | SHIFT | NEWSHIFT | S/N | NAME | SHIFT | NEWSHIFT | S/N |
| 0 | 19930045 | 0.00141087 | 0.00000 | 19.0729 | 19930046 | -0.491839 | 0.493250 | 19.0613 |
| 1 | 19930044 | 0.00107157 | 0.000339300 | 19.0762 | 19930043 | -0.493235 | 0.494646 | 19.0695 |
| 2 | 19930041 | 0.00000 | 0.00141087 | 18.9960 | 19930042 | -0.493638 | 0.495049 | 19.0241 |