| Red | Green | Blue | |
| z | 17.63 | ||
| znorm | Inf | ||
| sky | -NaN | -NaN | -NaN |
| S/N | 26.3 | 43.0 | 45.0 |
| S/N(c) | 0.0 | 0.0 | 0.0 |
| SN(E/C) |
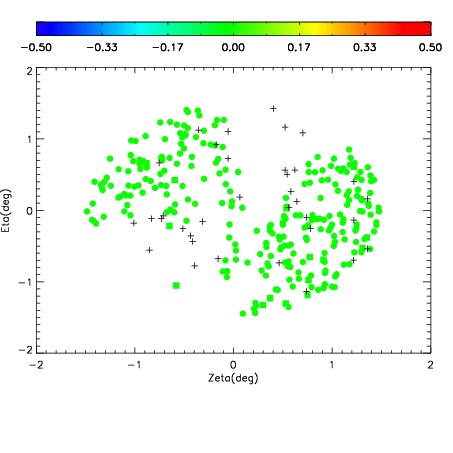
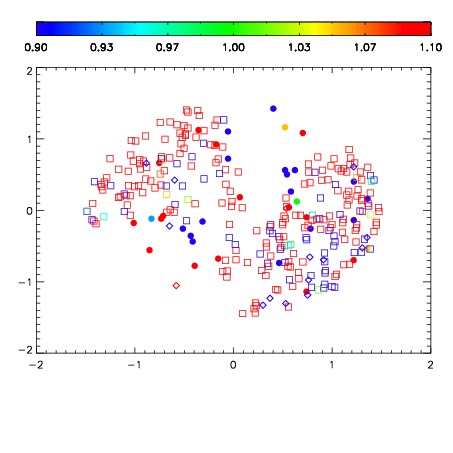


| Frame | Nreads | Zeropoints | Mag plots | Spatial mag deviation | Spatial sky 16325A emission deviations (filled: sky, open: star) | Spatial sky continuum emission | Spatial sky telluric CO2 absorption deviations (filled: H < 10) | |||||||||||||||||||||||
| 0 | 0 |
|
|
|
|
|
|
| IPAIR | NAME | SHIFT | NEWSHIFT | S/N | NAME | SHIFT | NEWSHIFT | S/N |
| 0 | 19940053 | 0.494737 | 0.00000 | 19.0031 | 19940047 | 0.00000 | 0.494737 | 18.9680 |
| 1 | 19940049 | 0.493856 | 0.000880986 | 18.9804 | 19940050 | -0.00704039 | 0.501777 | 18.9637 |
| 2 | 19940048 | 0.493220 | 0.00151700 | 18.9607 | 19940051 | -0.00673397 | 0.501471 | 18.9189 |
| 3 | 19940052 | 0.494370 | 0.000366986 | 18.9333 | 19940054 | -0.00294703 | 0.497684 | 18.5299 |