Quick Links
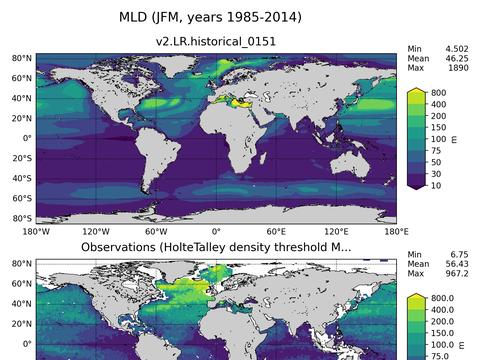
Global Mixed-Layer Depth
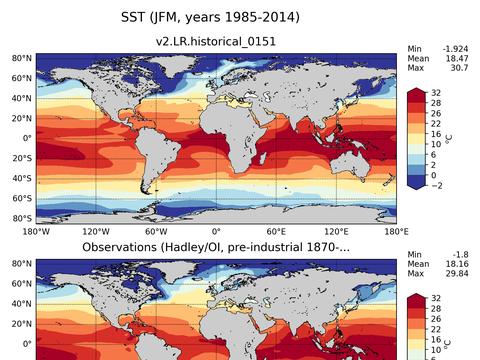
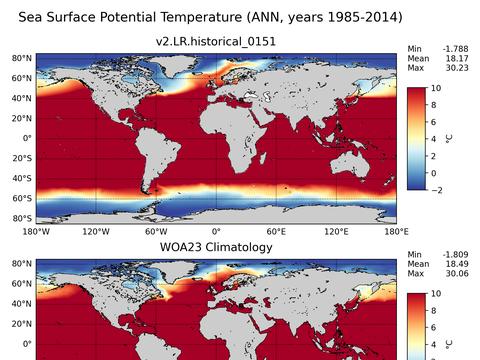
Global Sea Surface Temperature
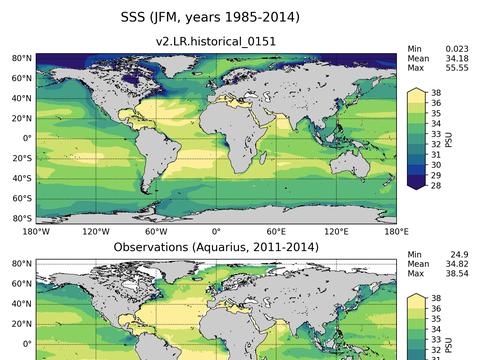
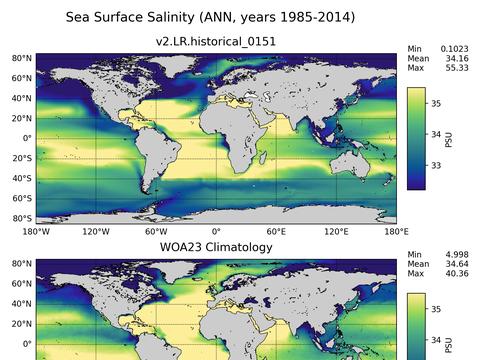
Global Sea Surface Salinity
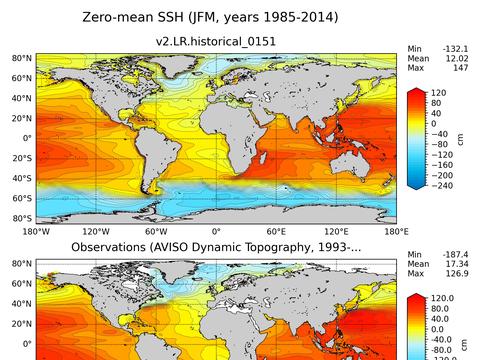
Global Sea Surface Height

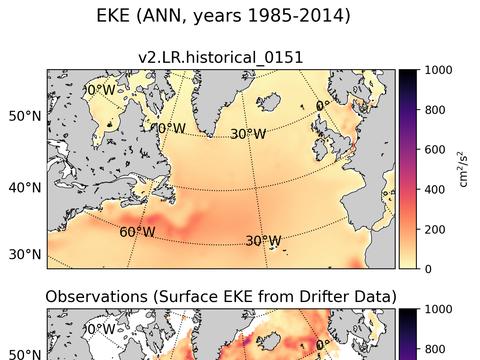
Global Eddy Kinetic Energy
Subpolar North Atlantic Eddy Kinetic Energy
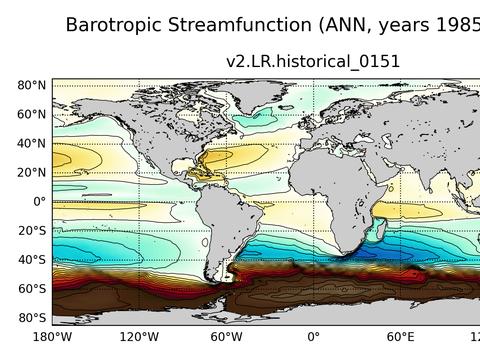
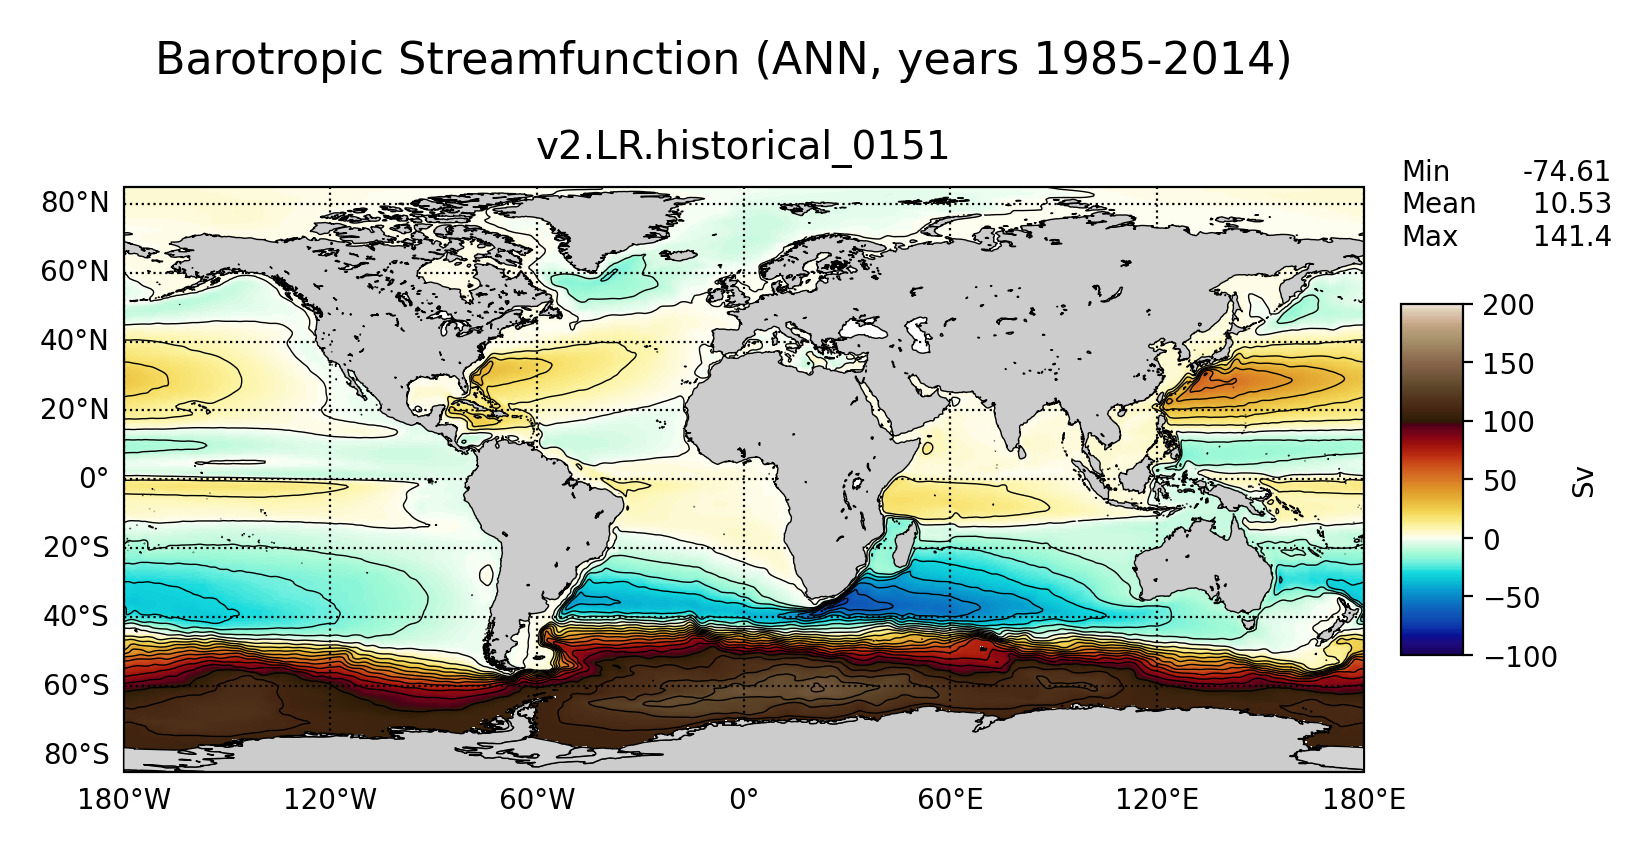
Global Horizontal Streamfunction
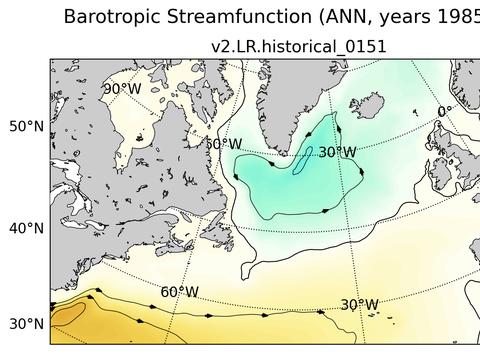
Subpolar North Atlantic Horizontal Streamfunction

Antarctic Potential Temperature
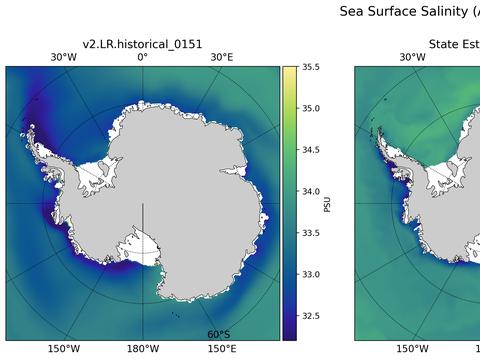
Antarctic Salinity
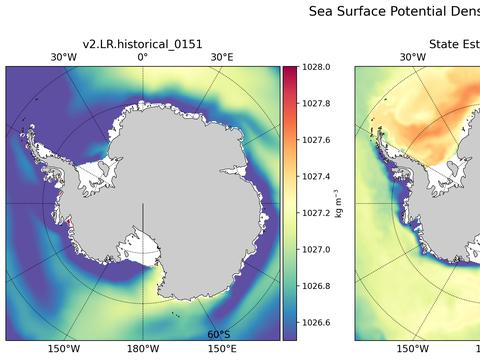
Antarctic Potential Density
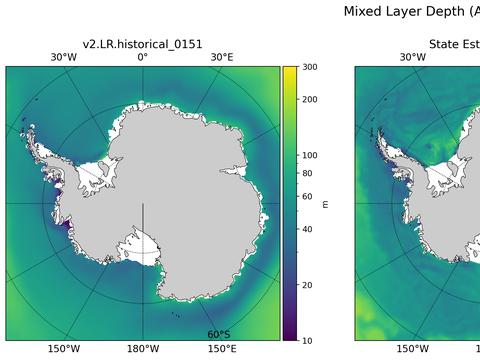
Antarctic Mixed Layer Depth
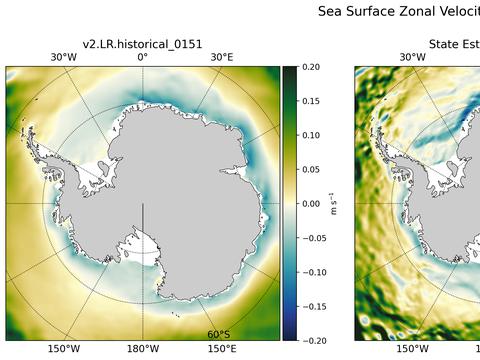
Antarctic Zonal Velocity
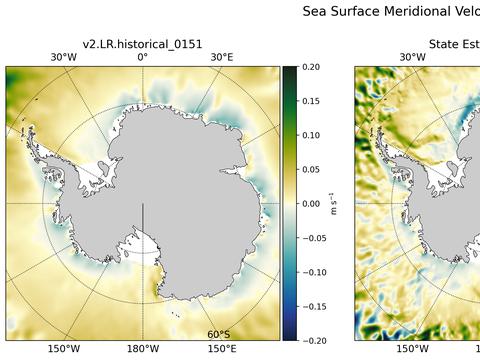
Antarctic Meridional Velocity
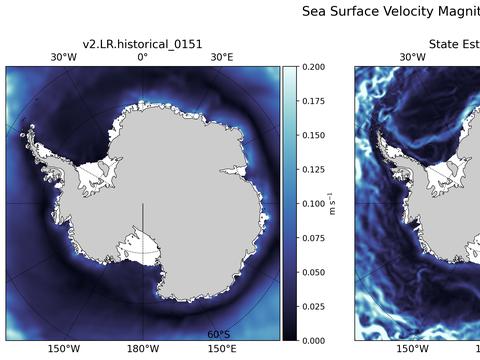
Antarctic Velocity Magnitude
Global Potential Temperature
Global Salinity

Global Argo Potential Temperature
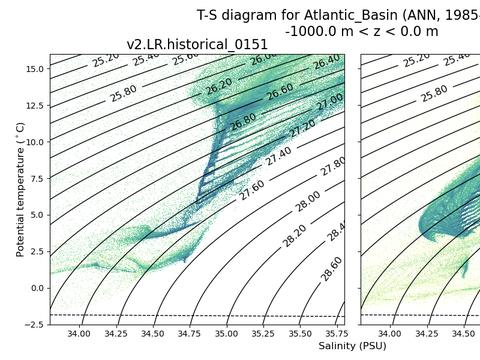
T-S Diagrams
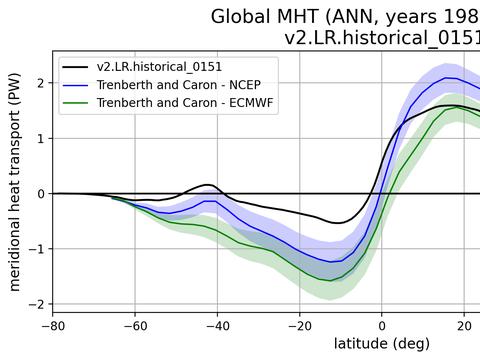
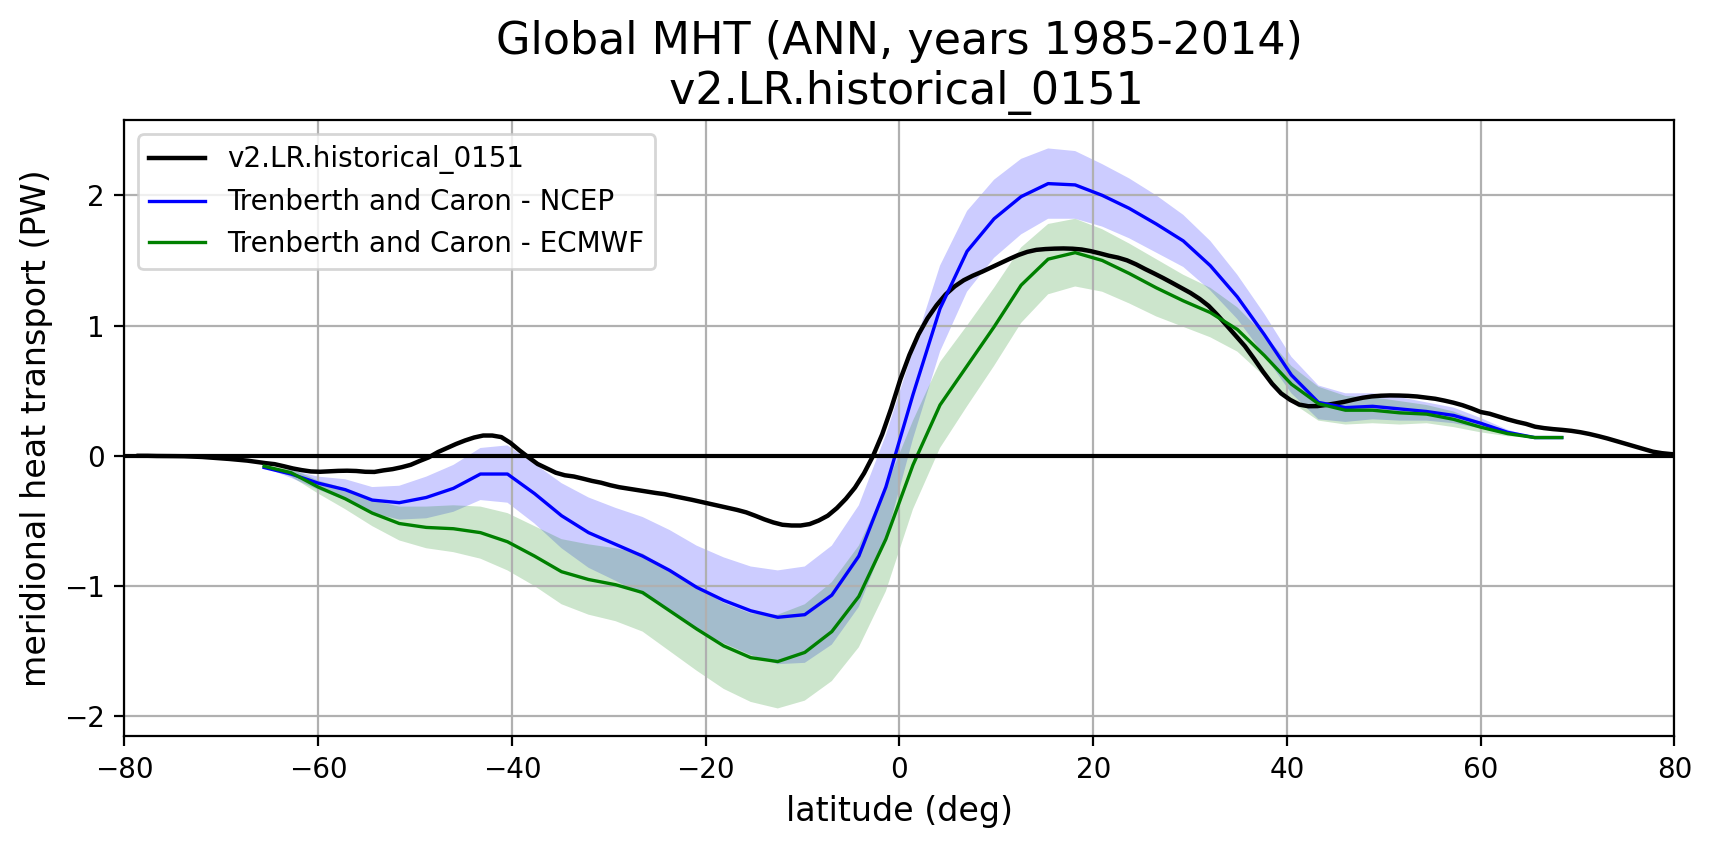
Meridional Heat Transport
Observations: Holte-Talley ARGO
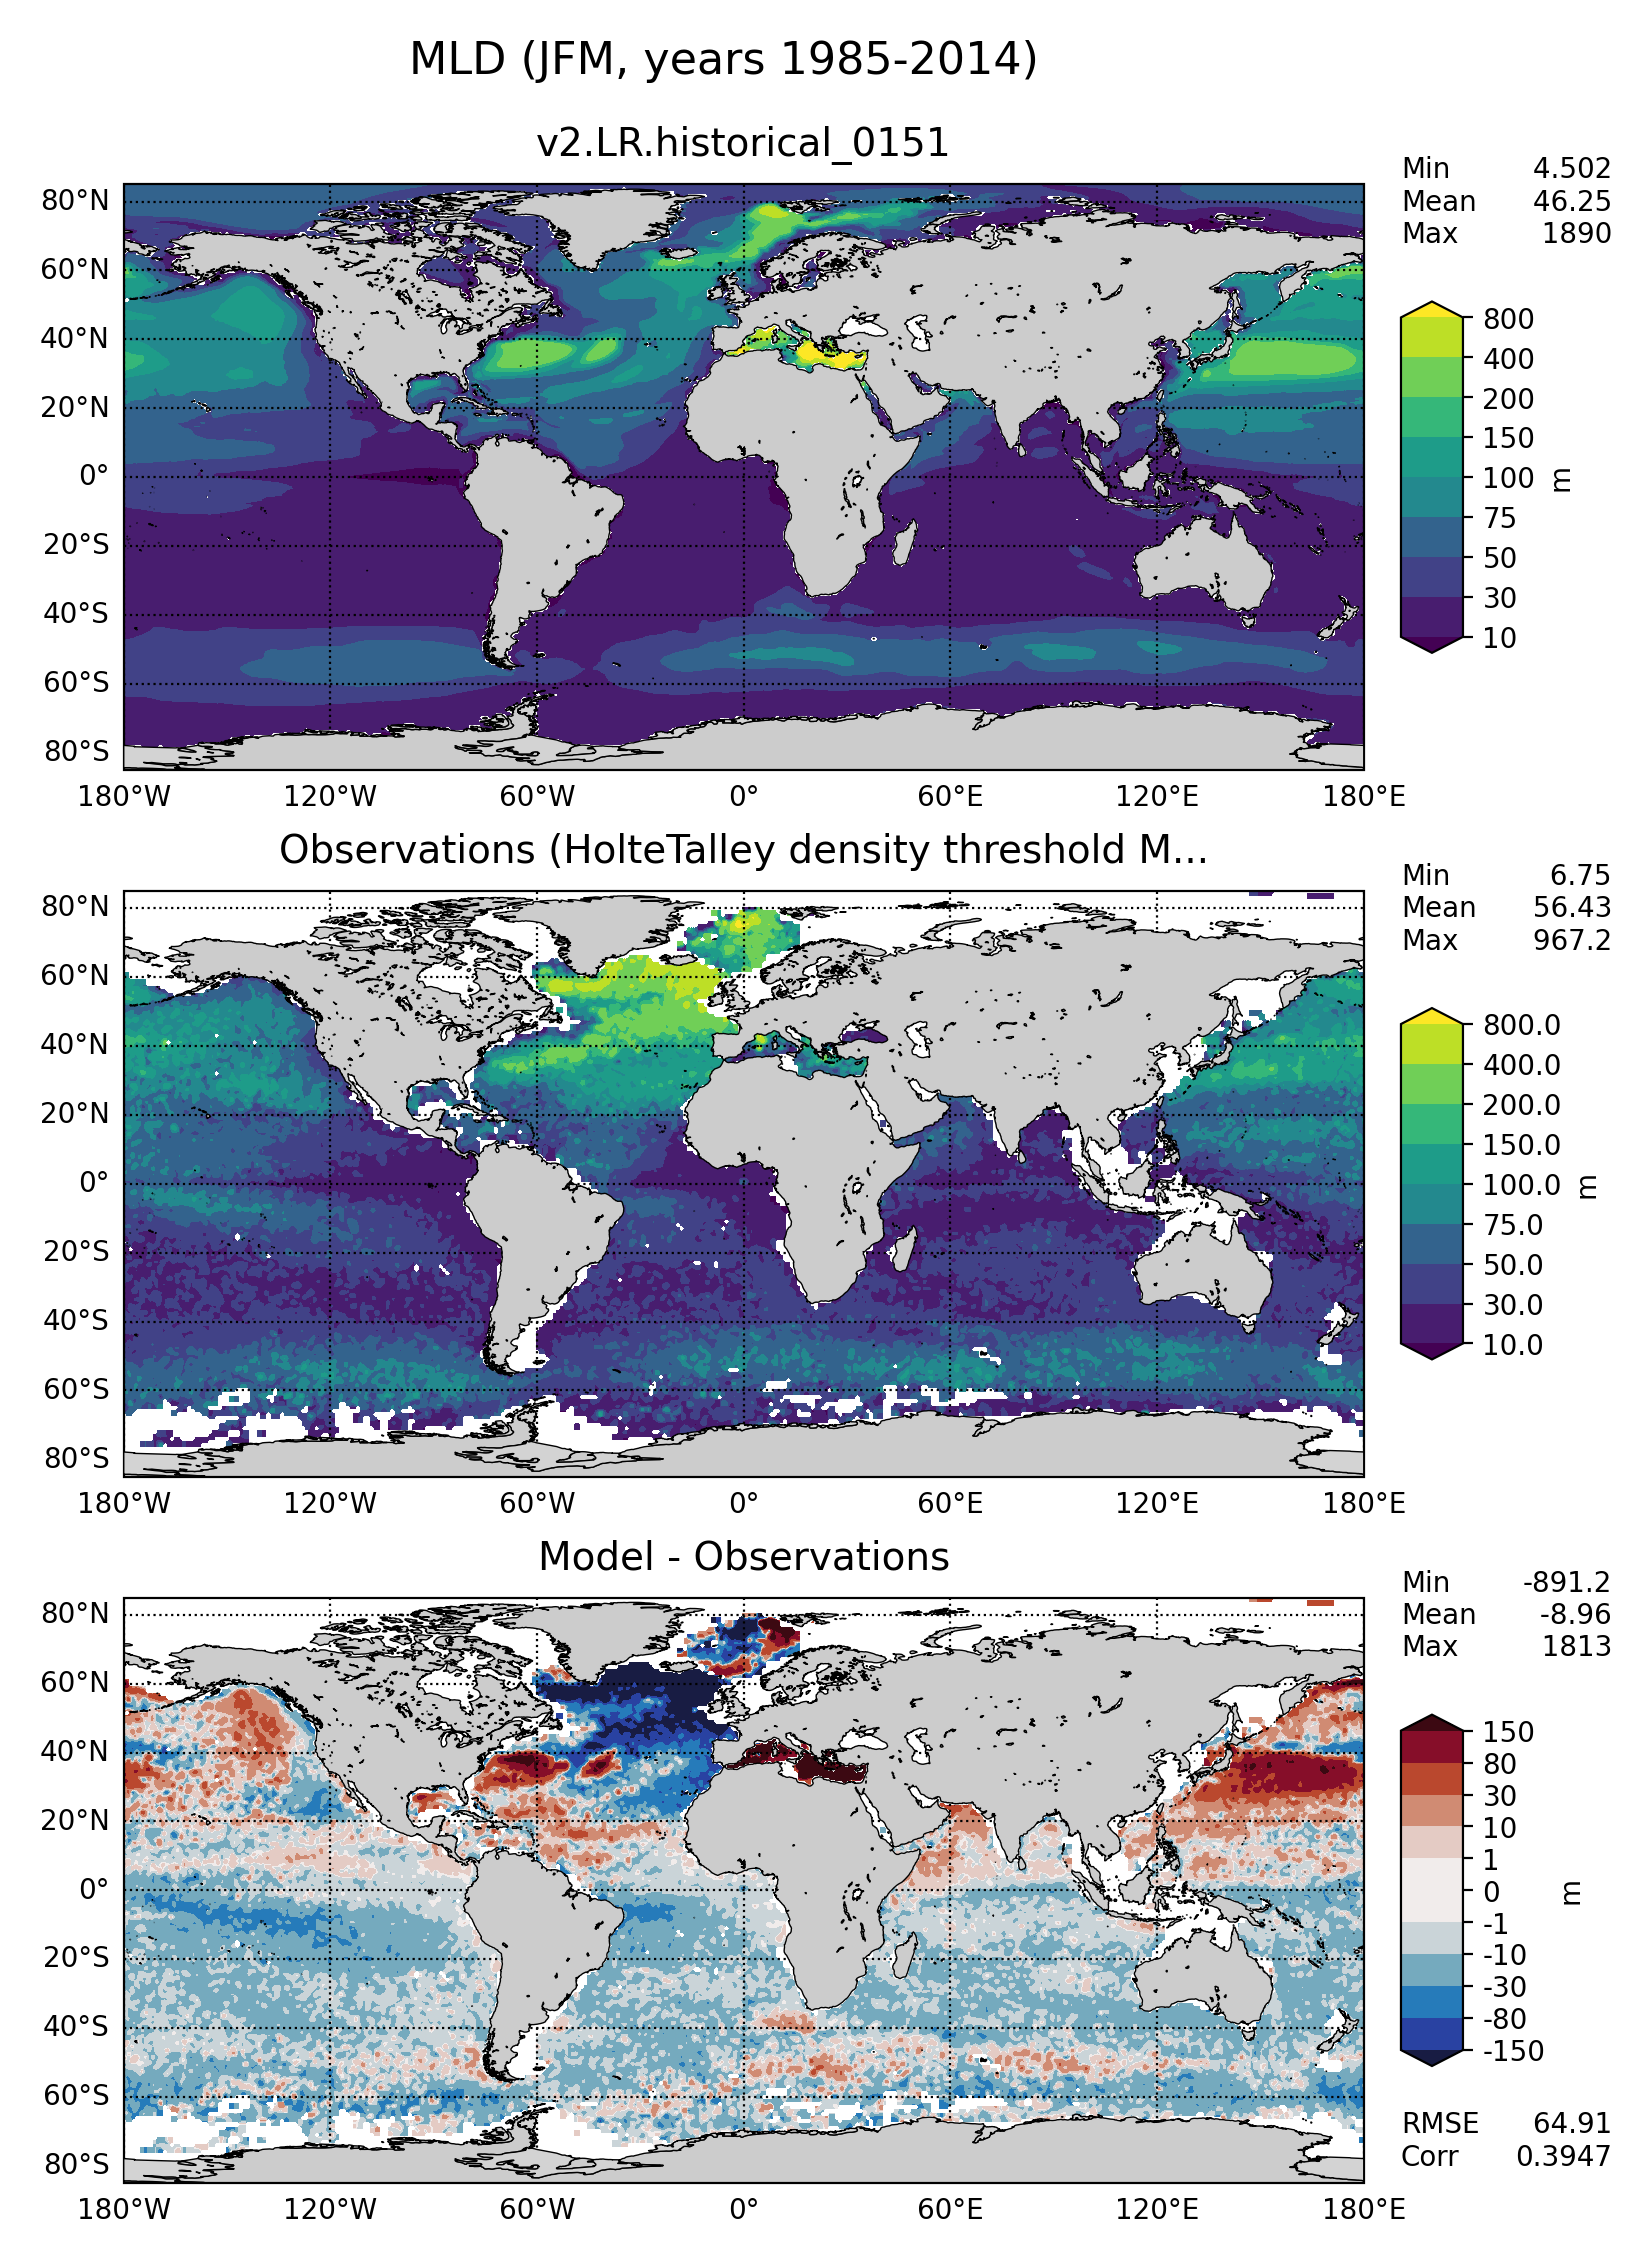
JFM
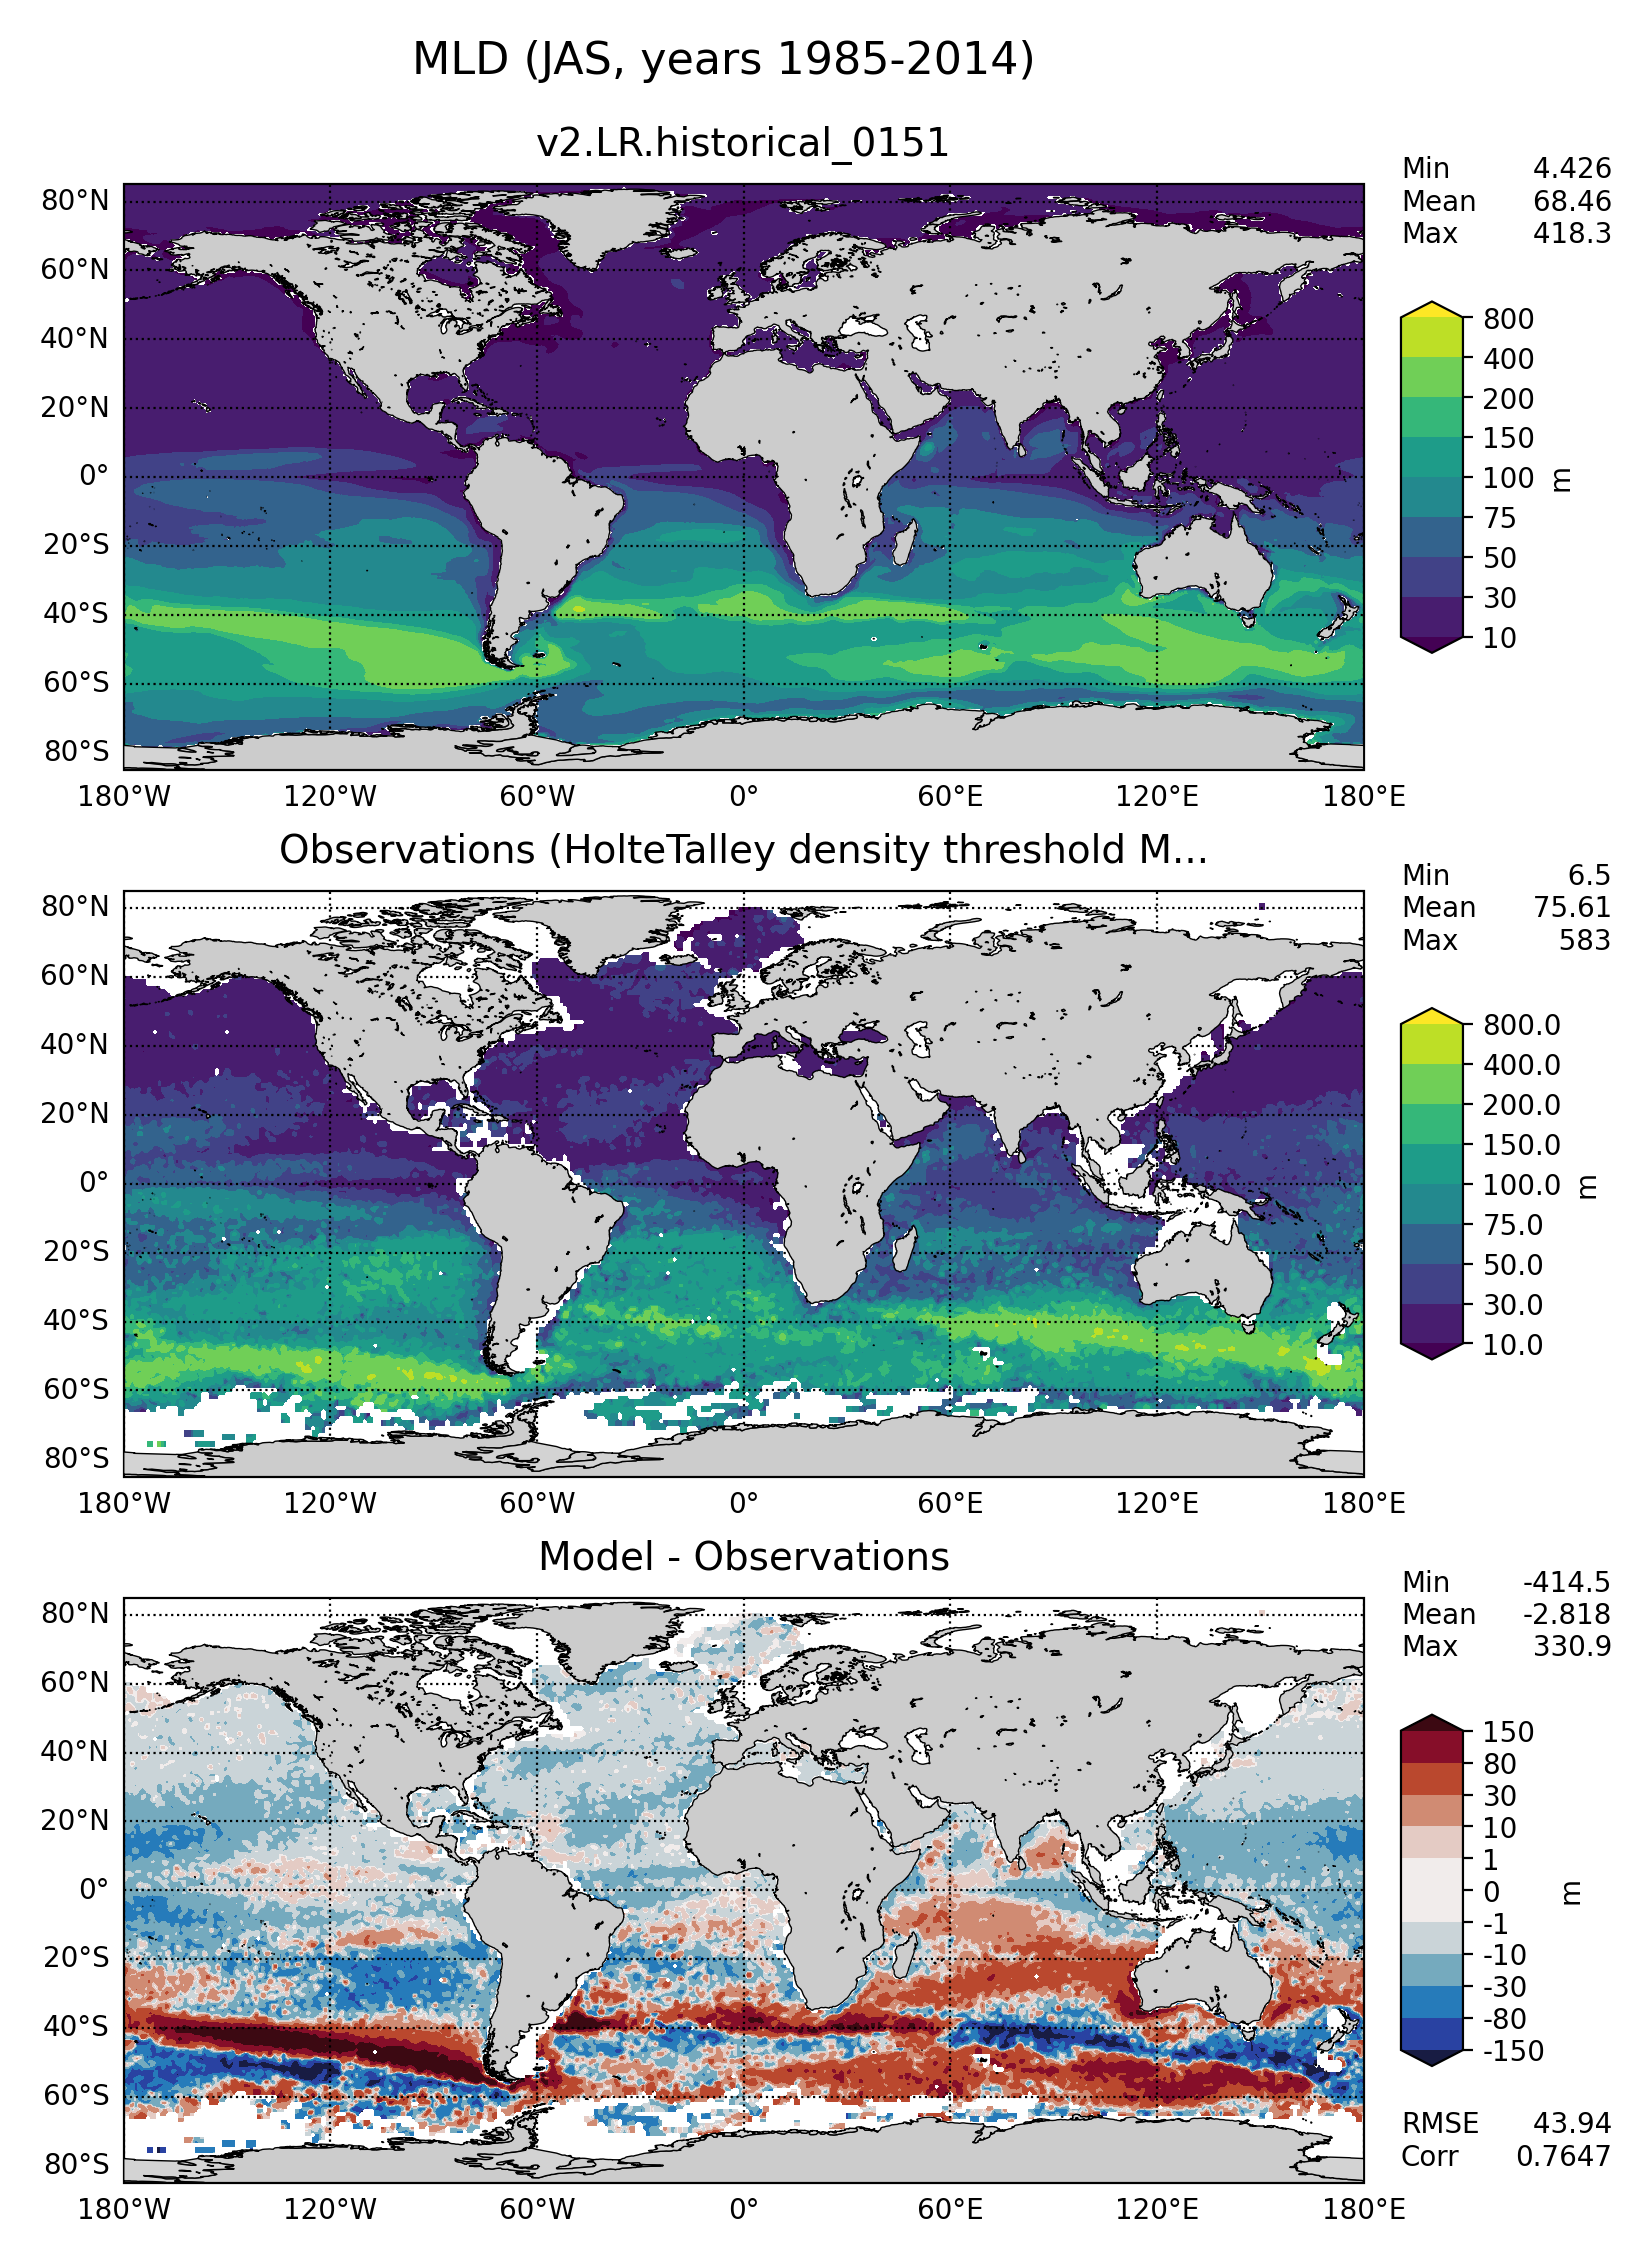
JAS
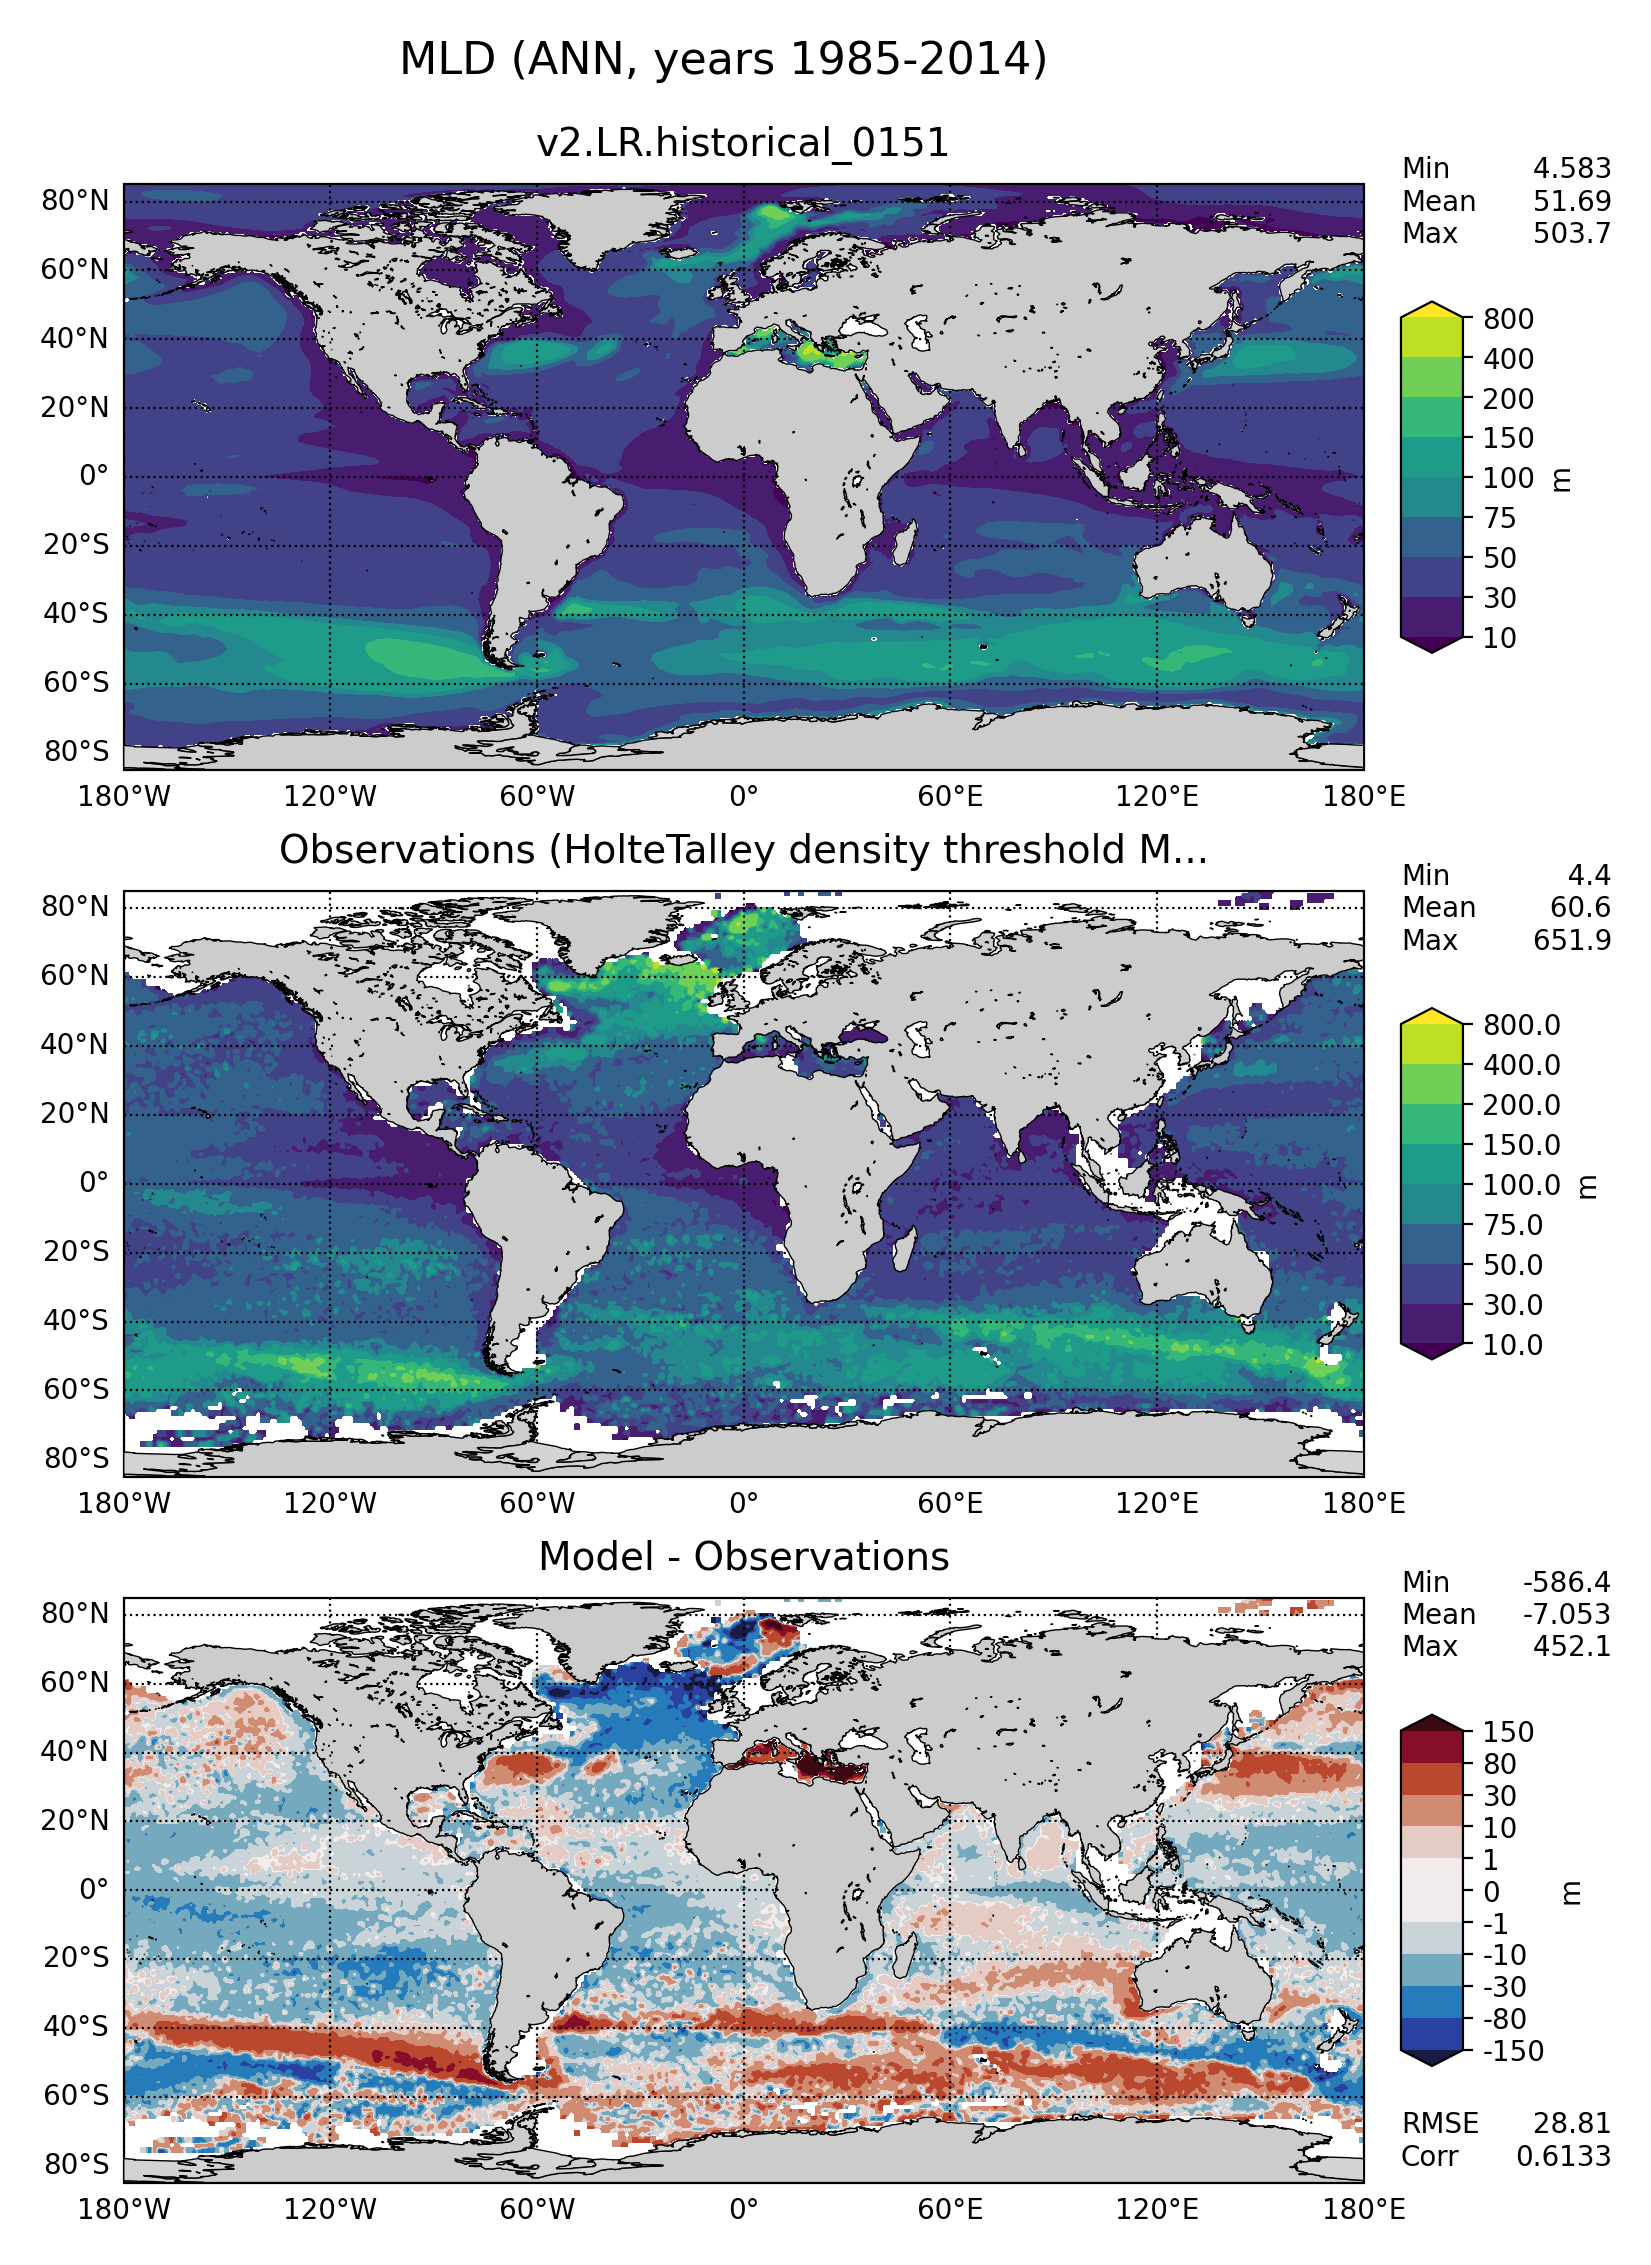
ANN
Observations: Hadley-NOAA-OI
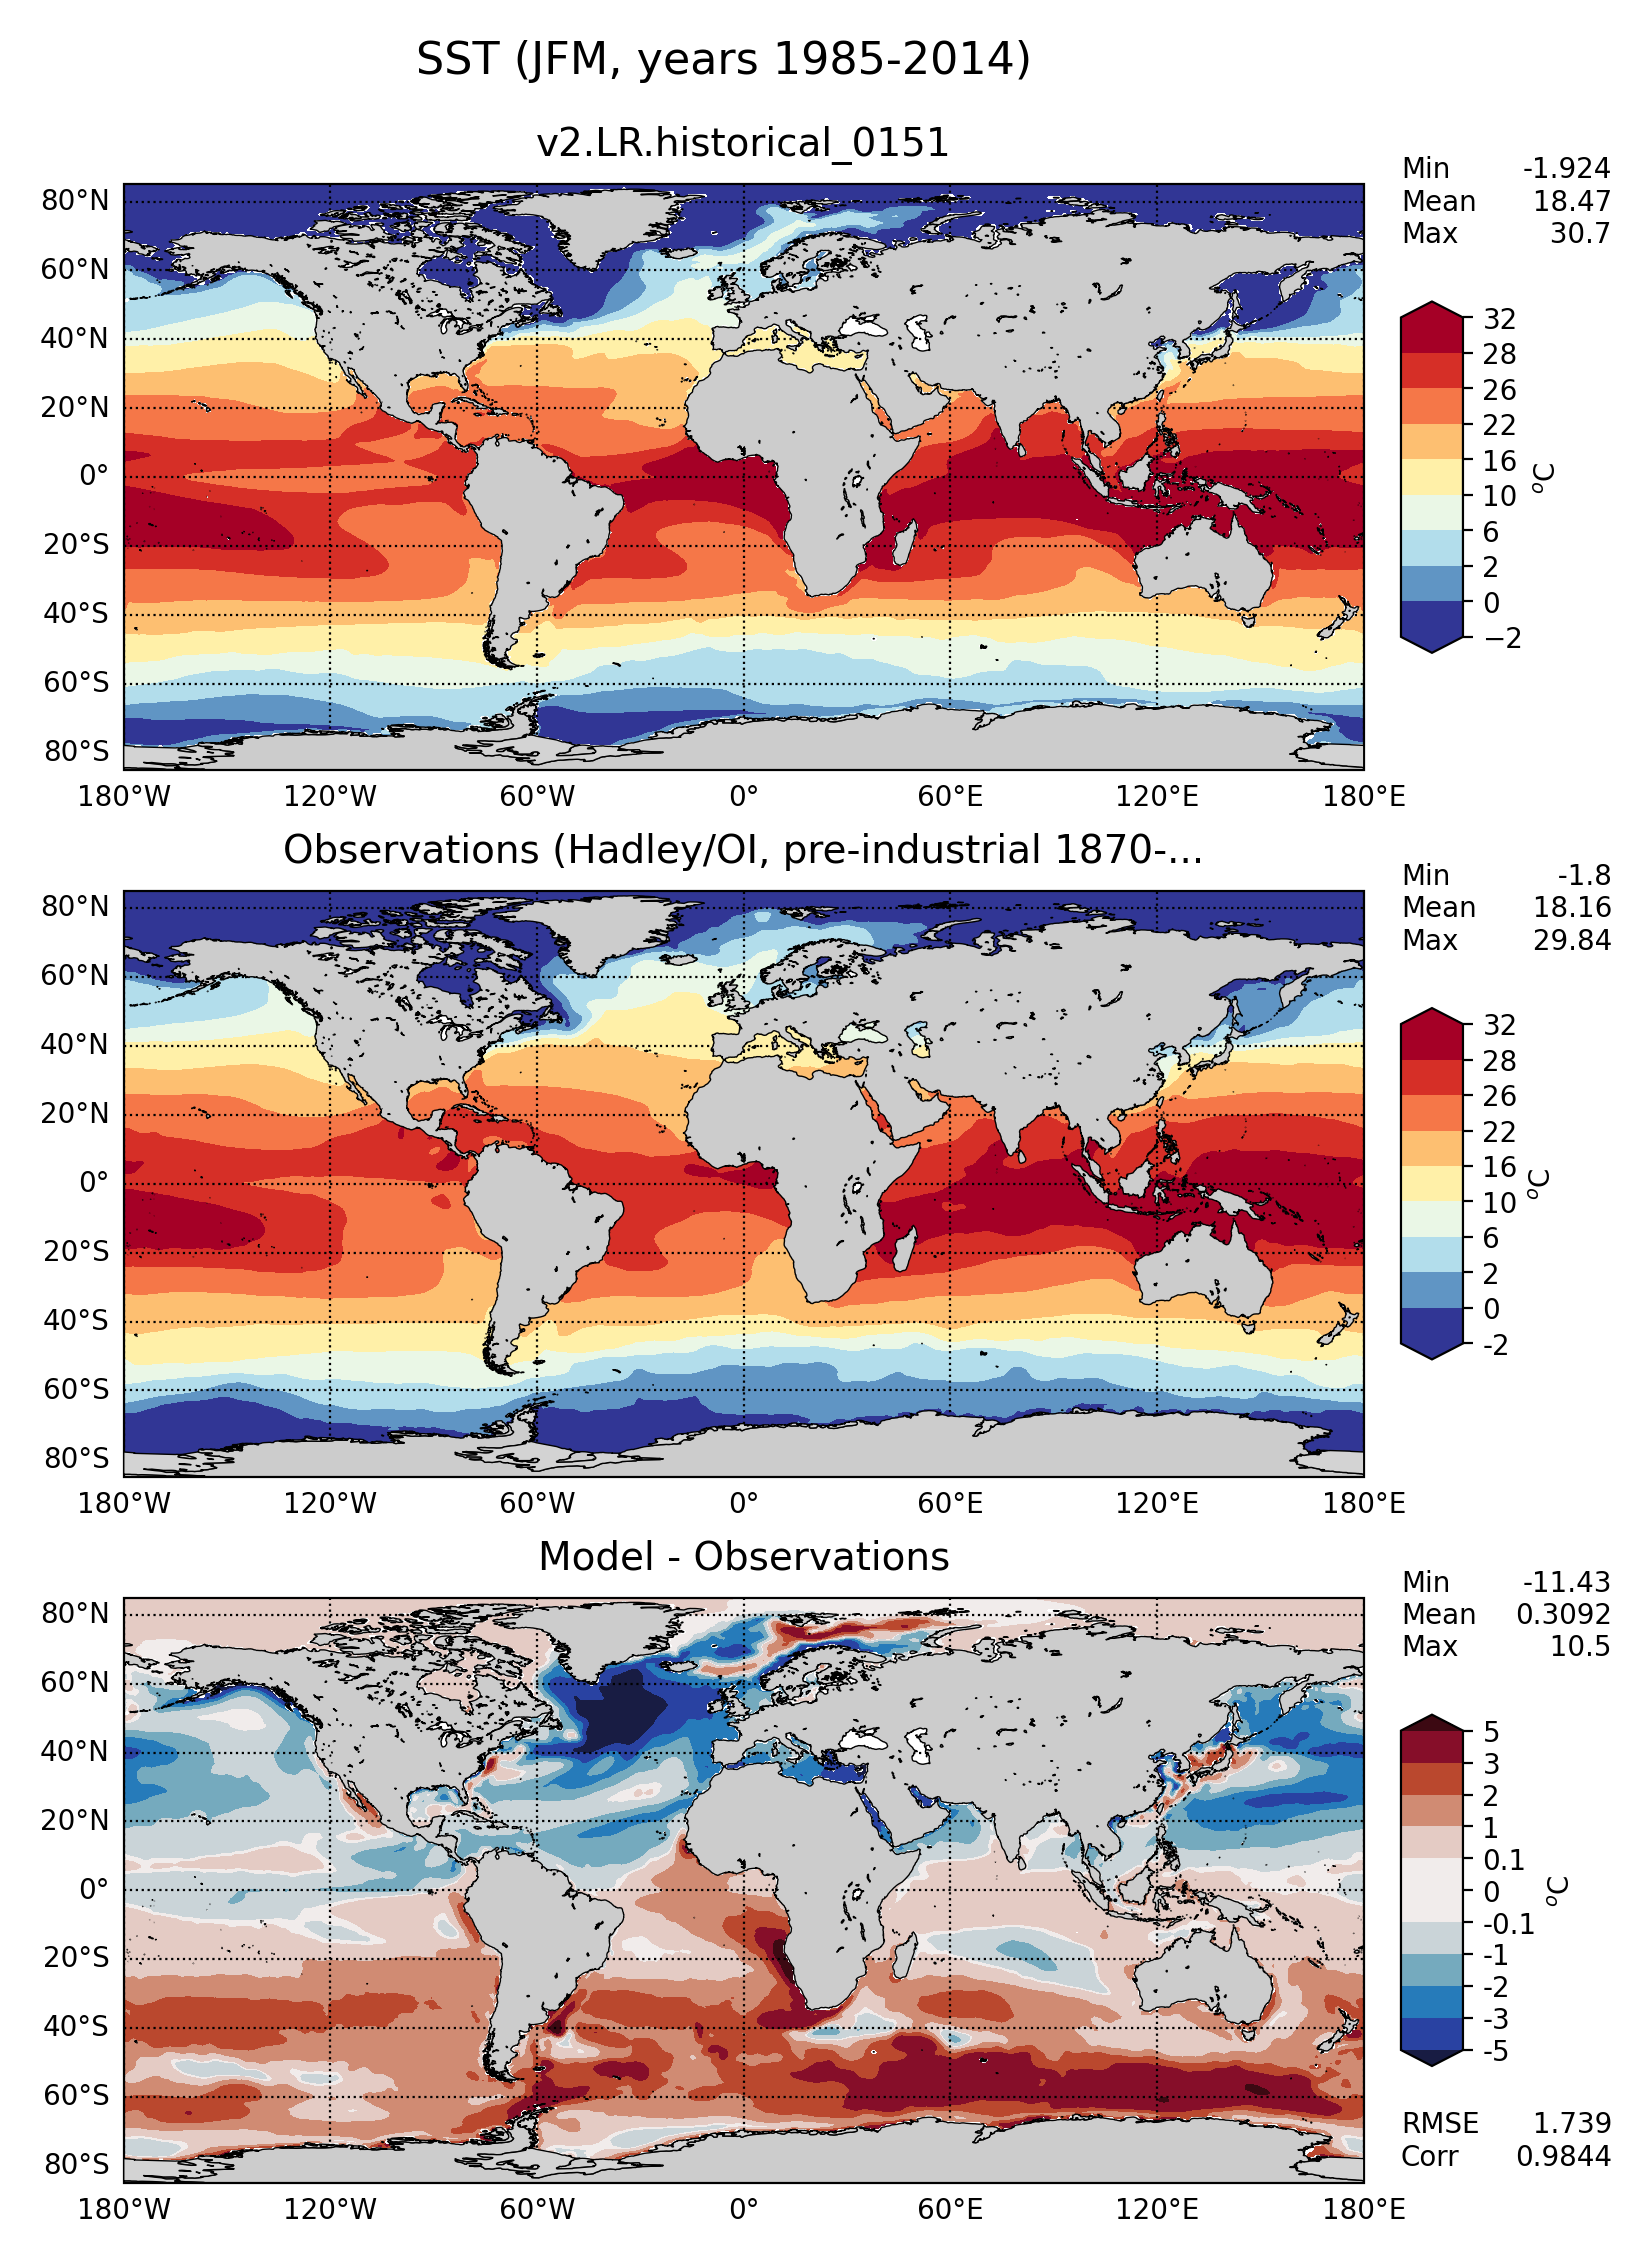
JFM
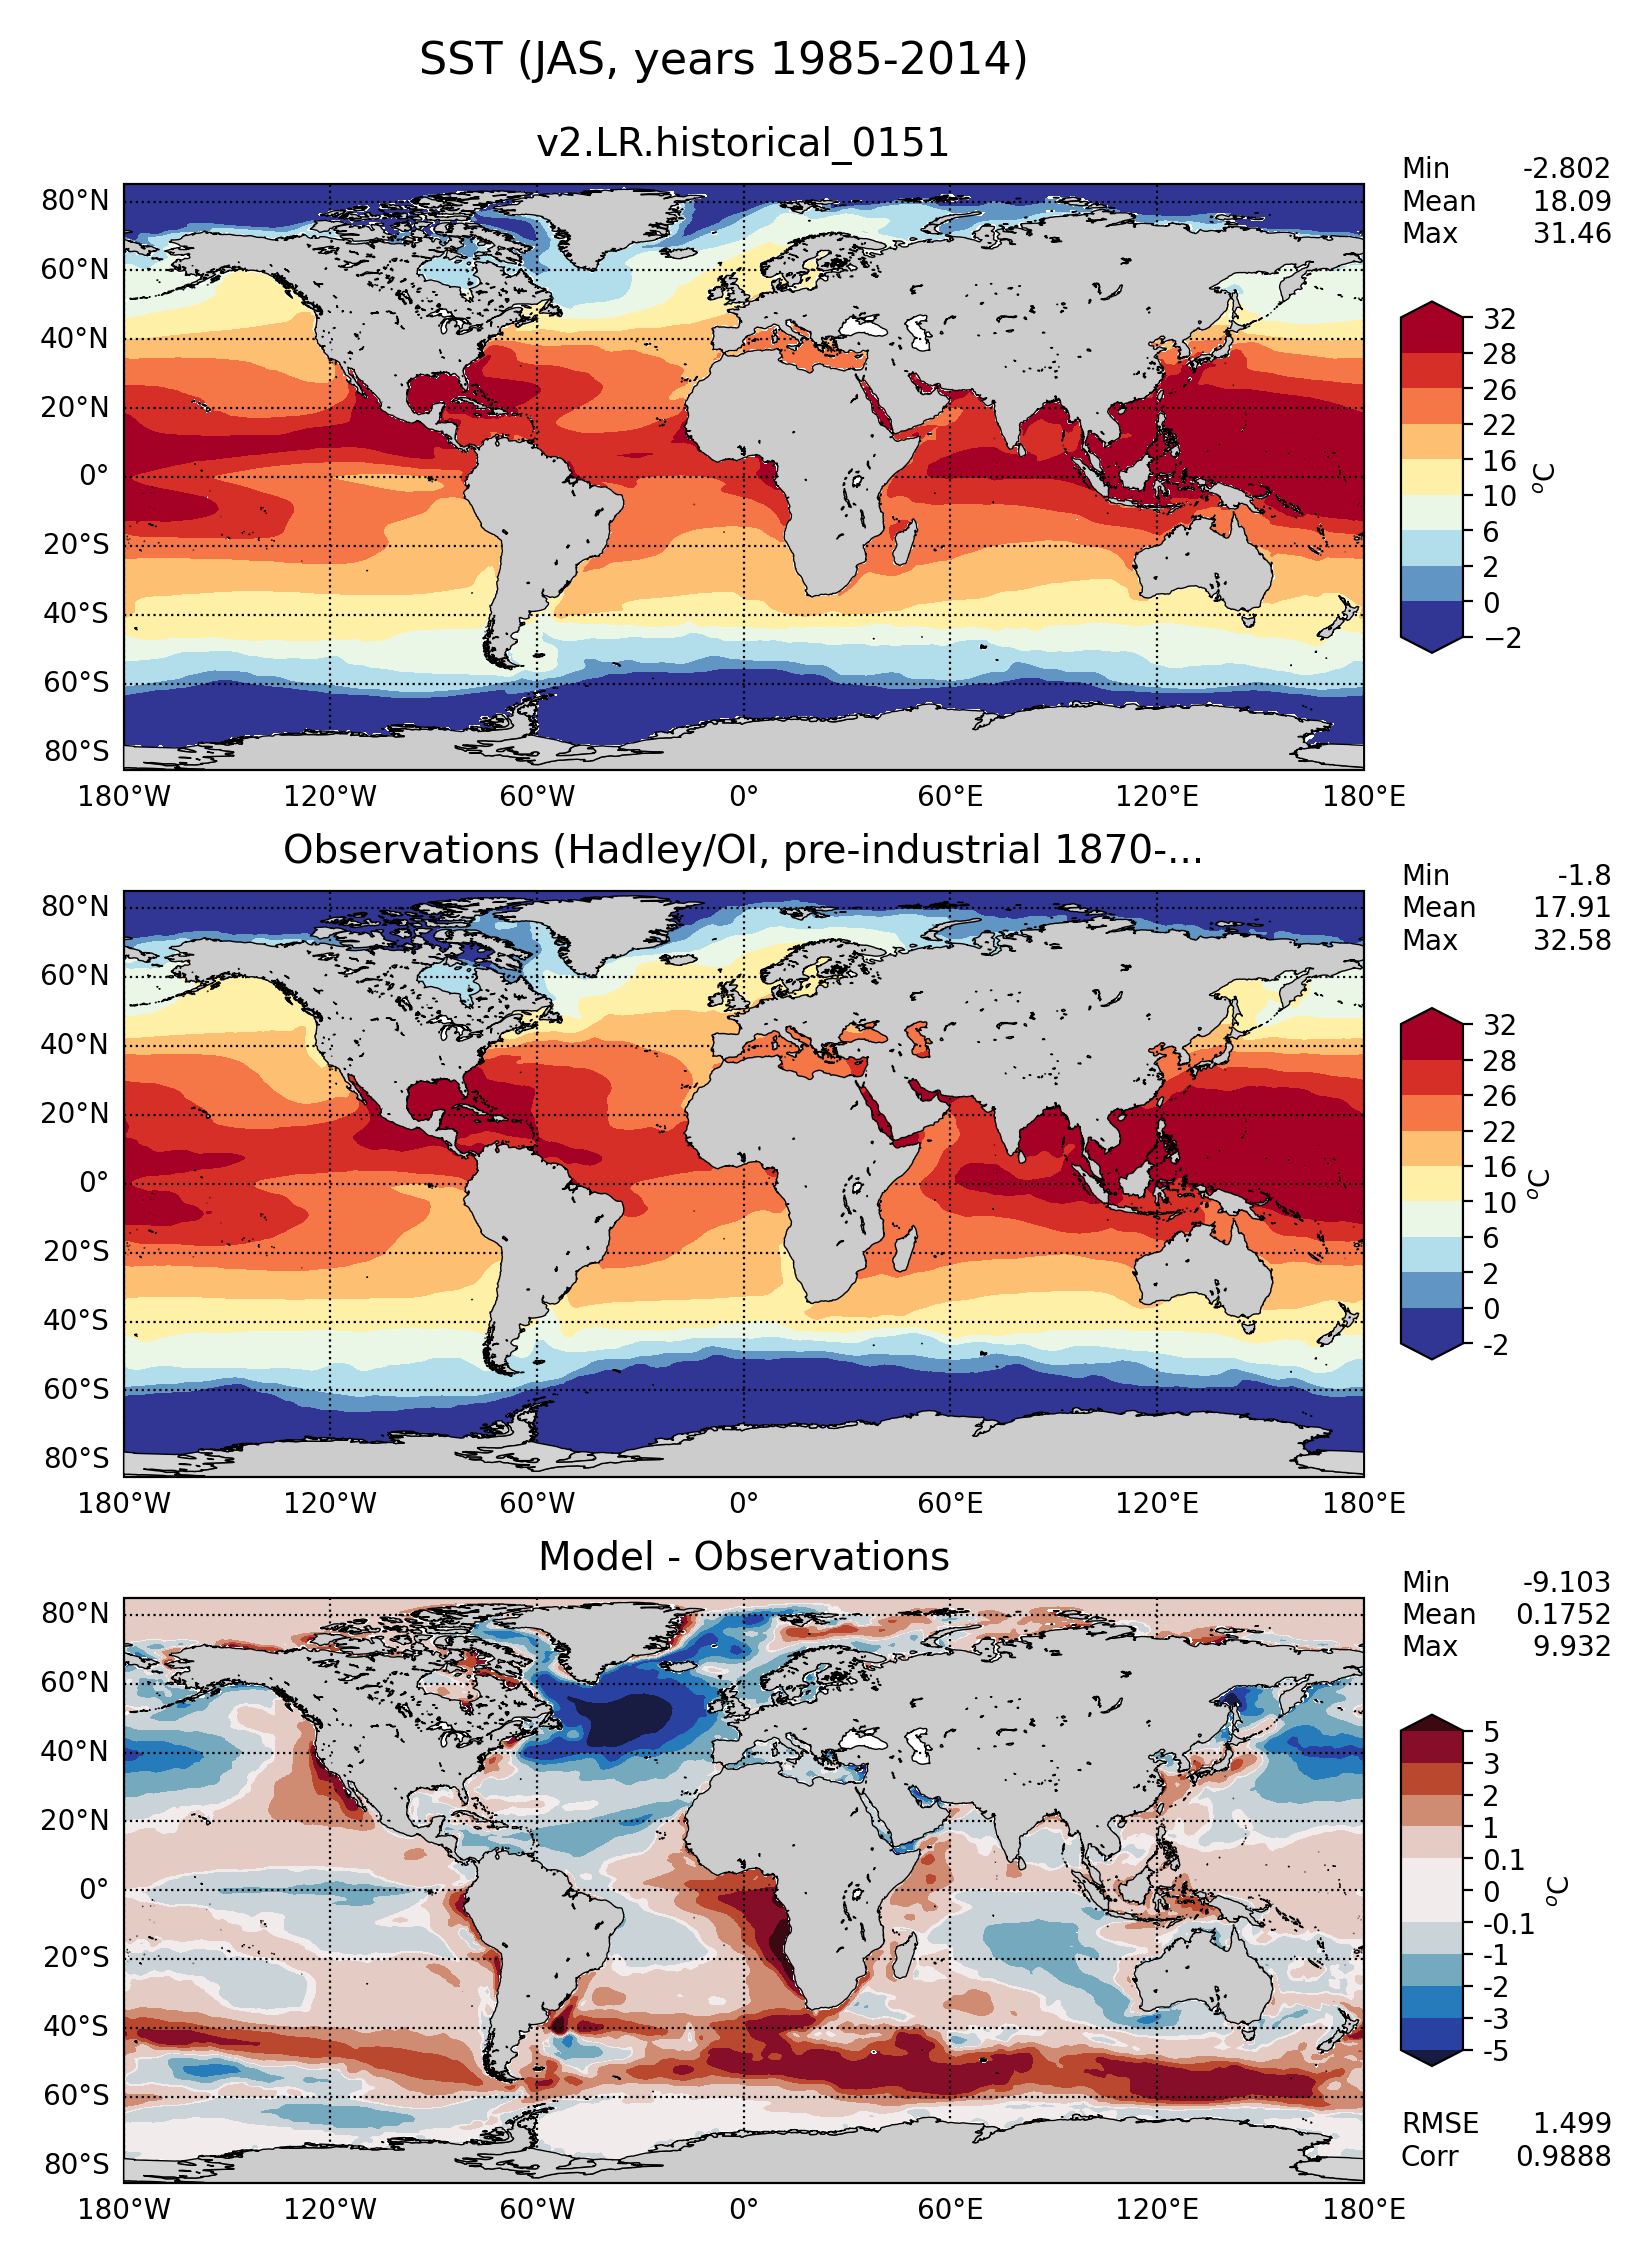
JAS
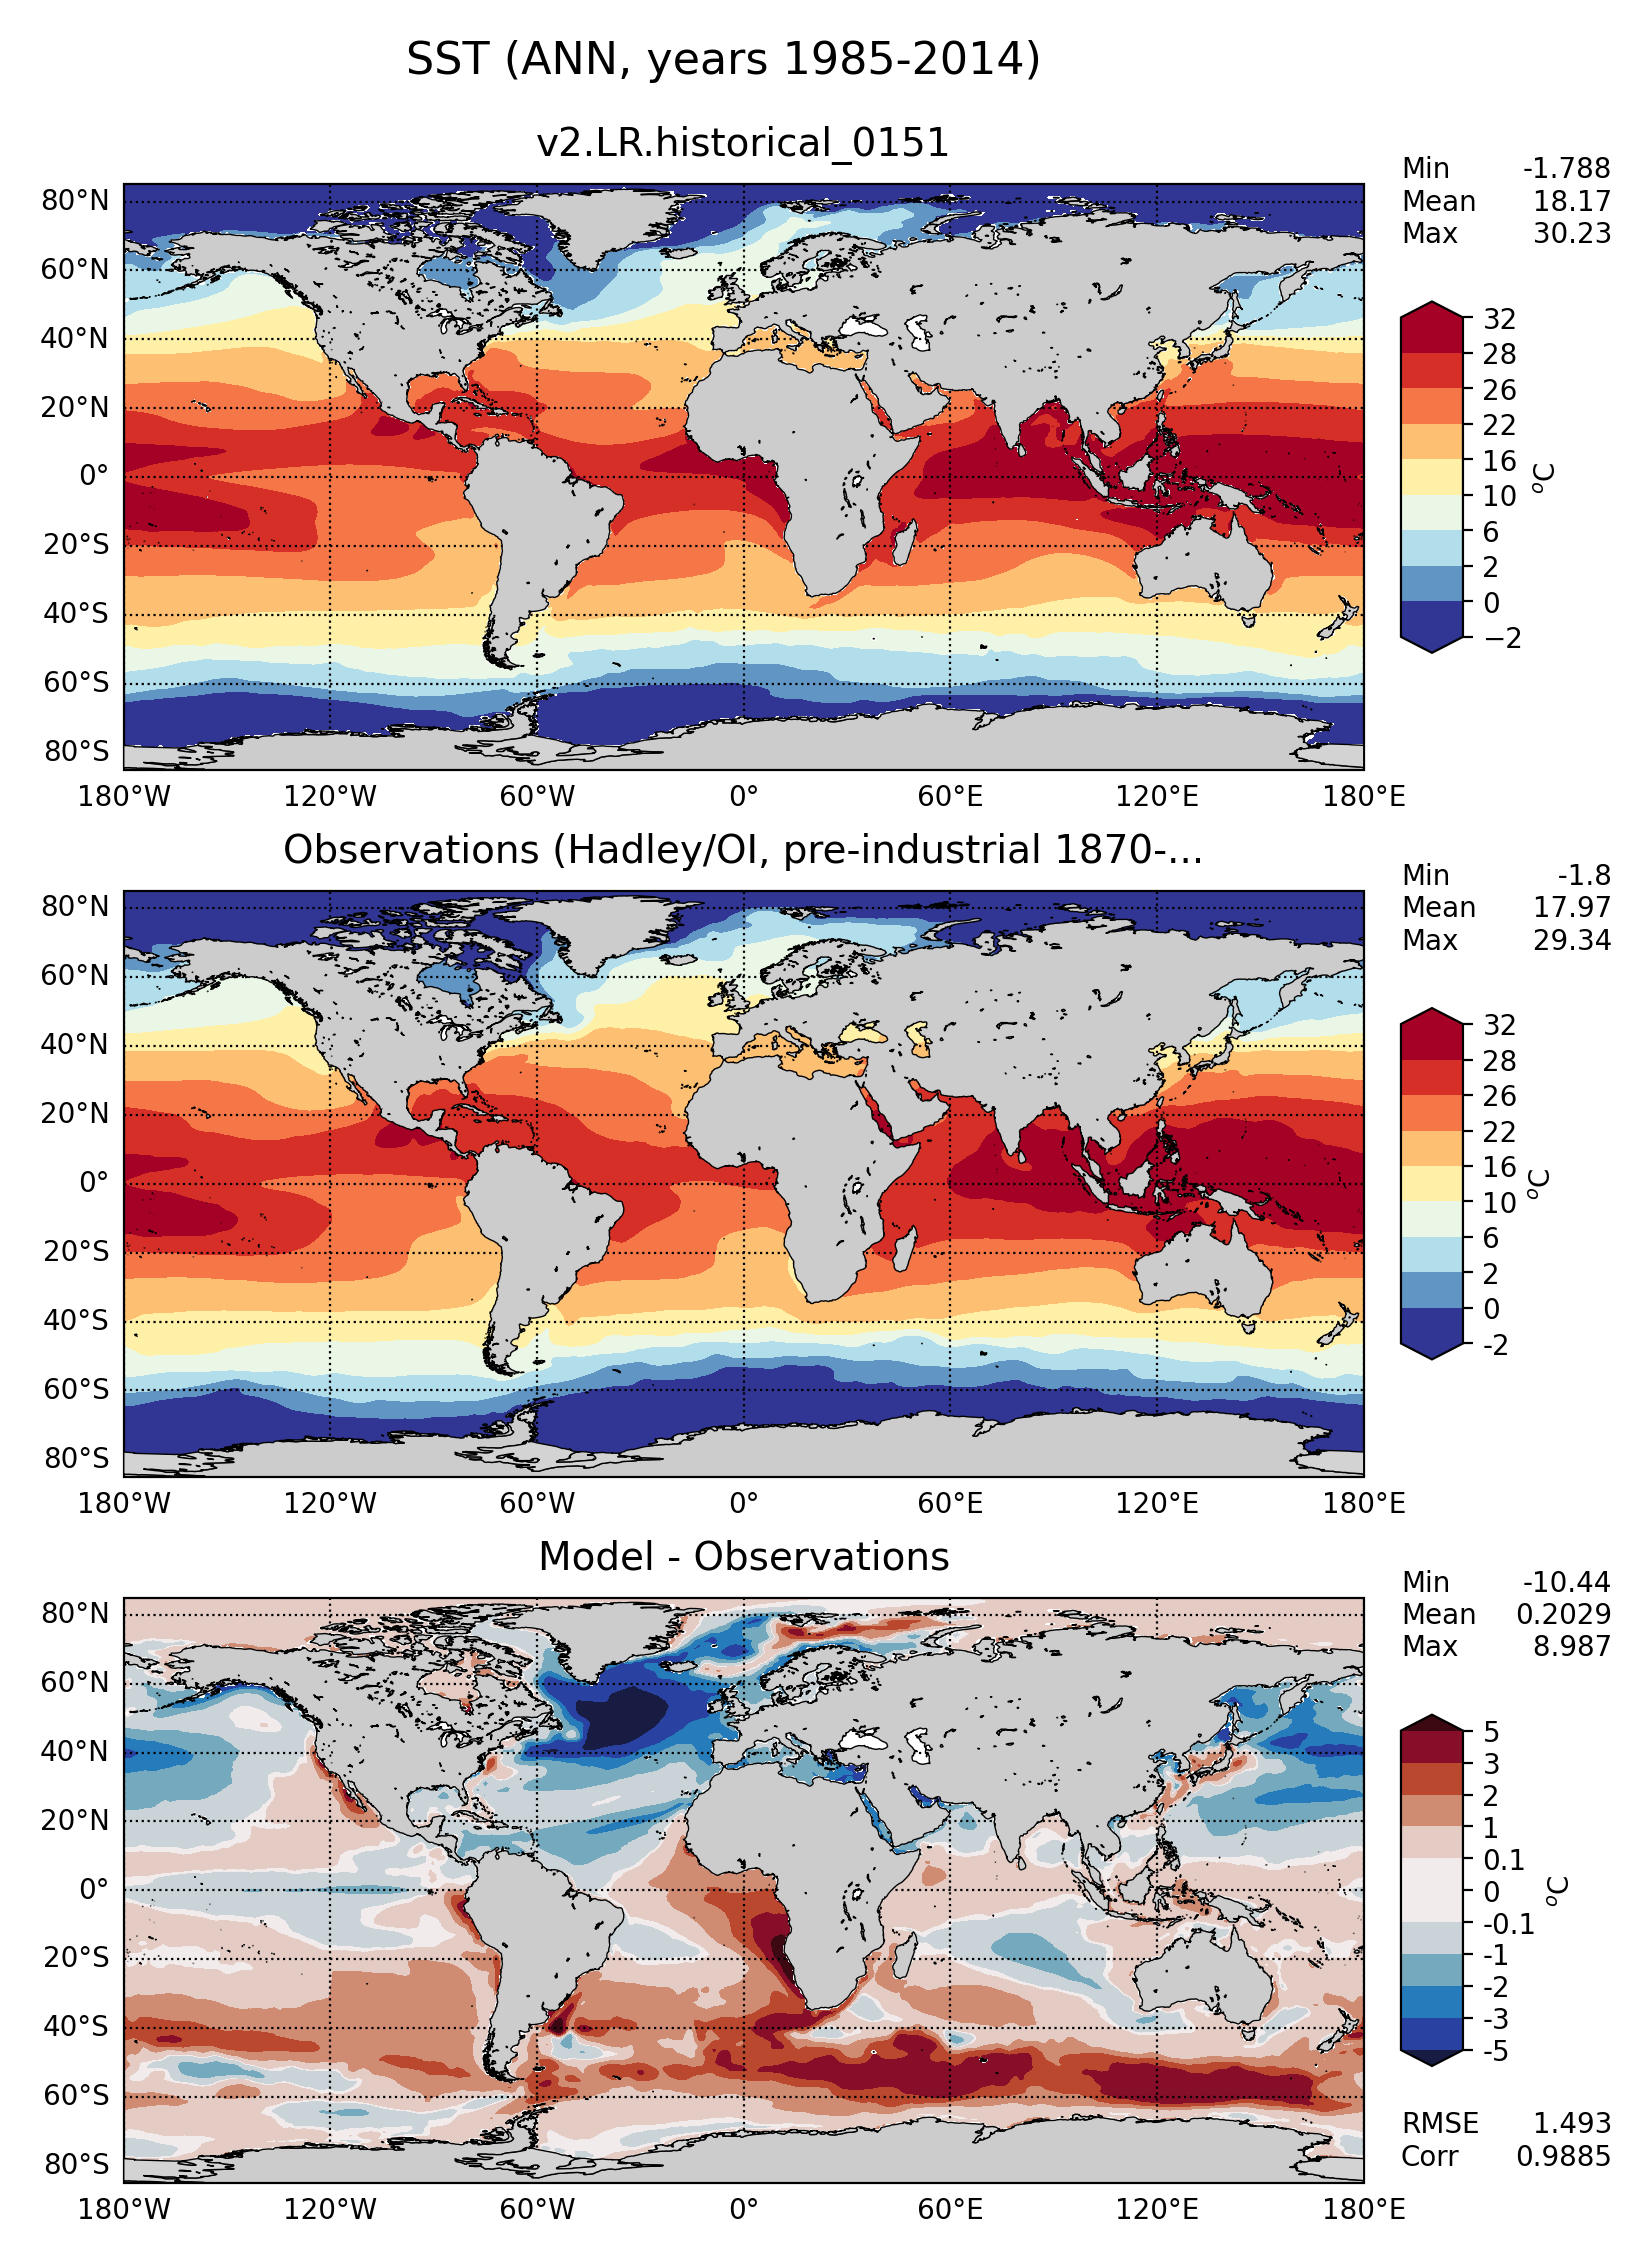
ANN
Observations: Aquarius
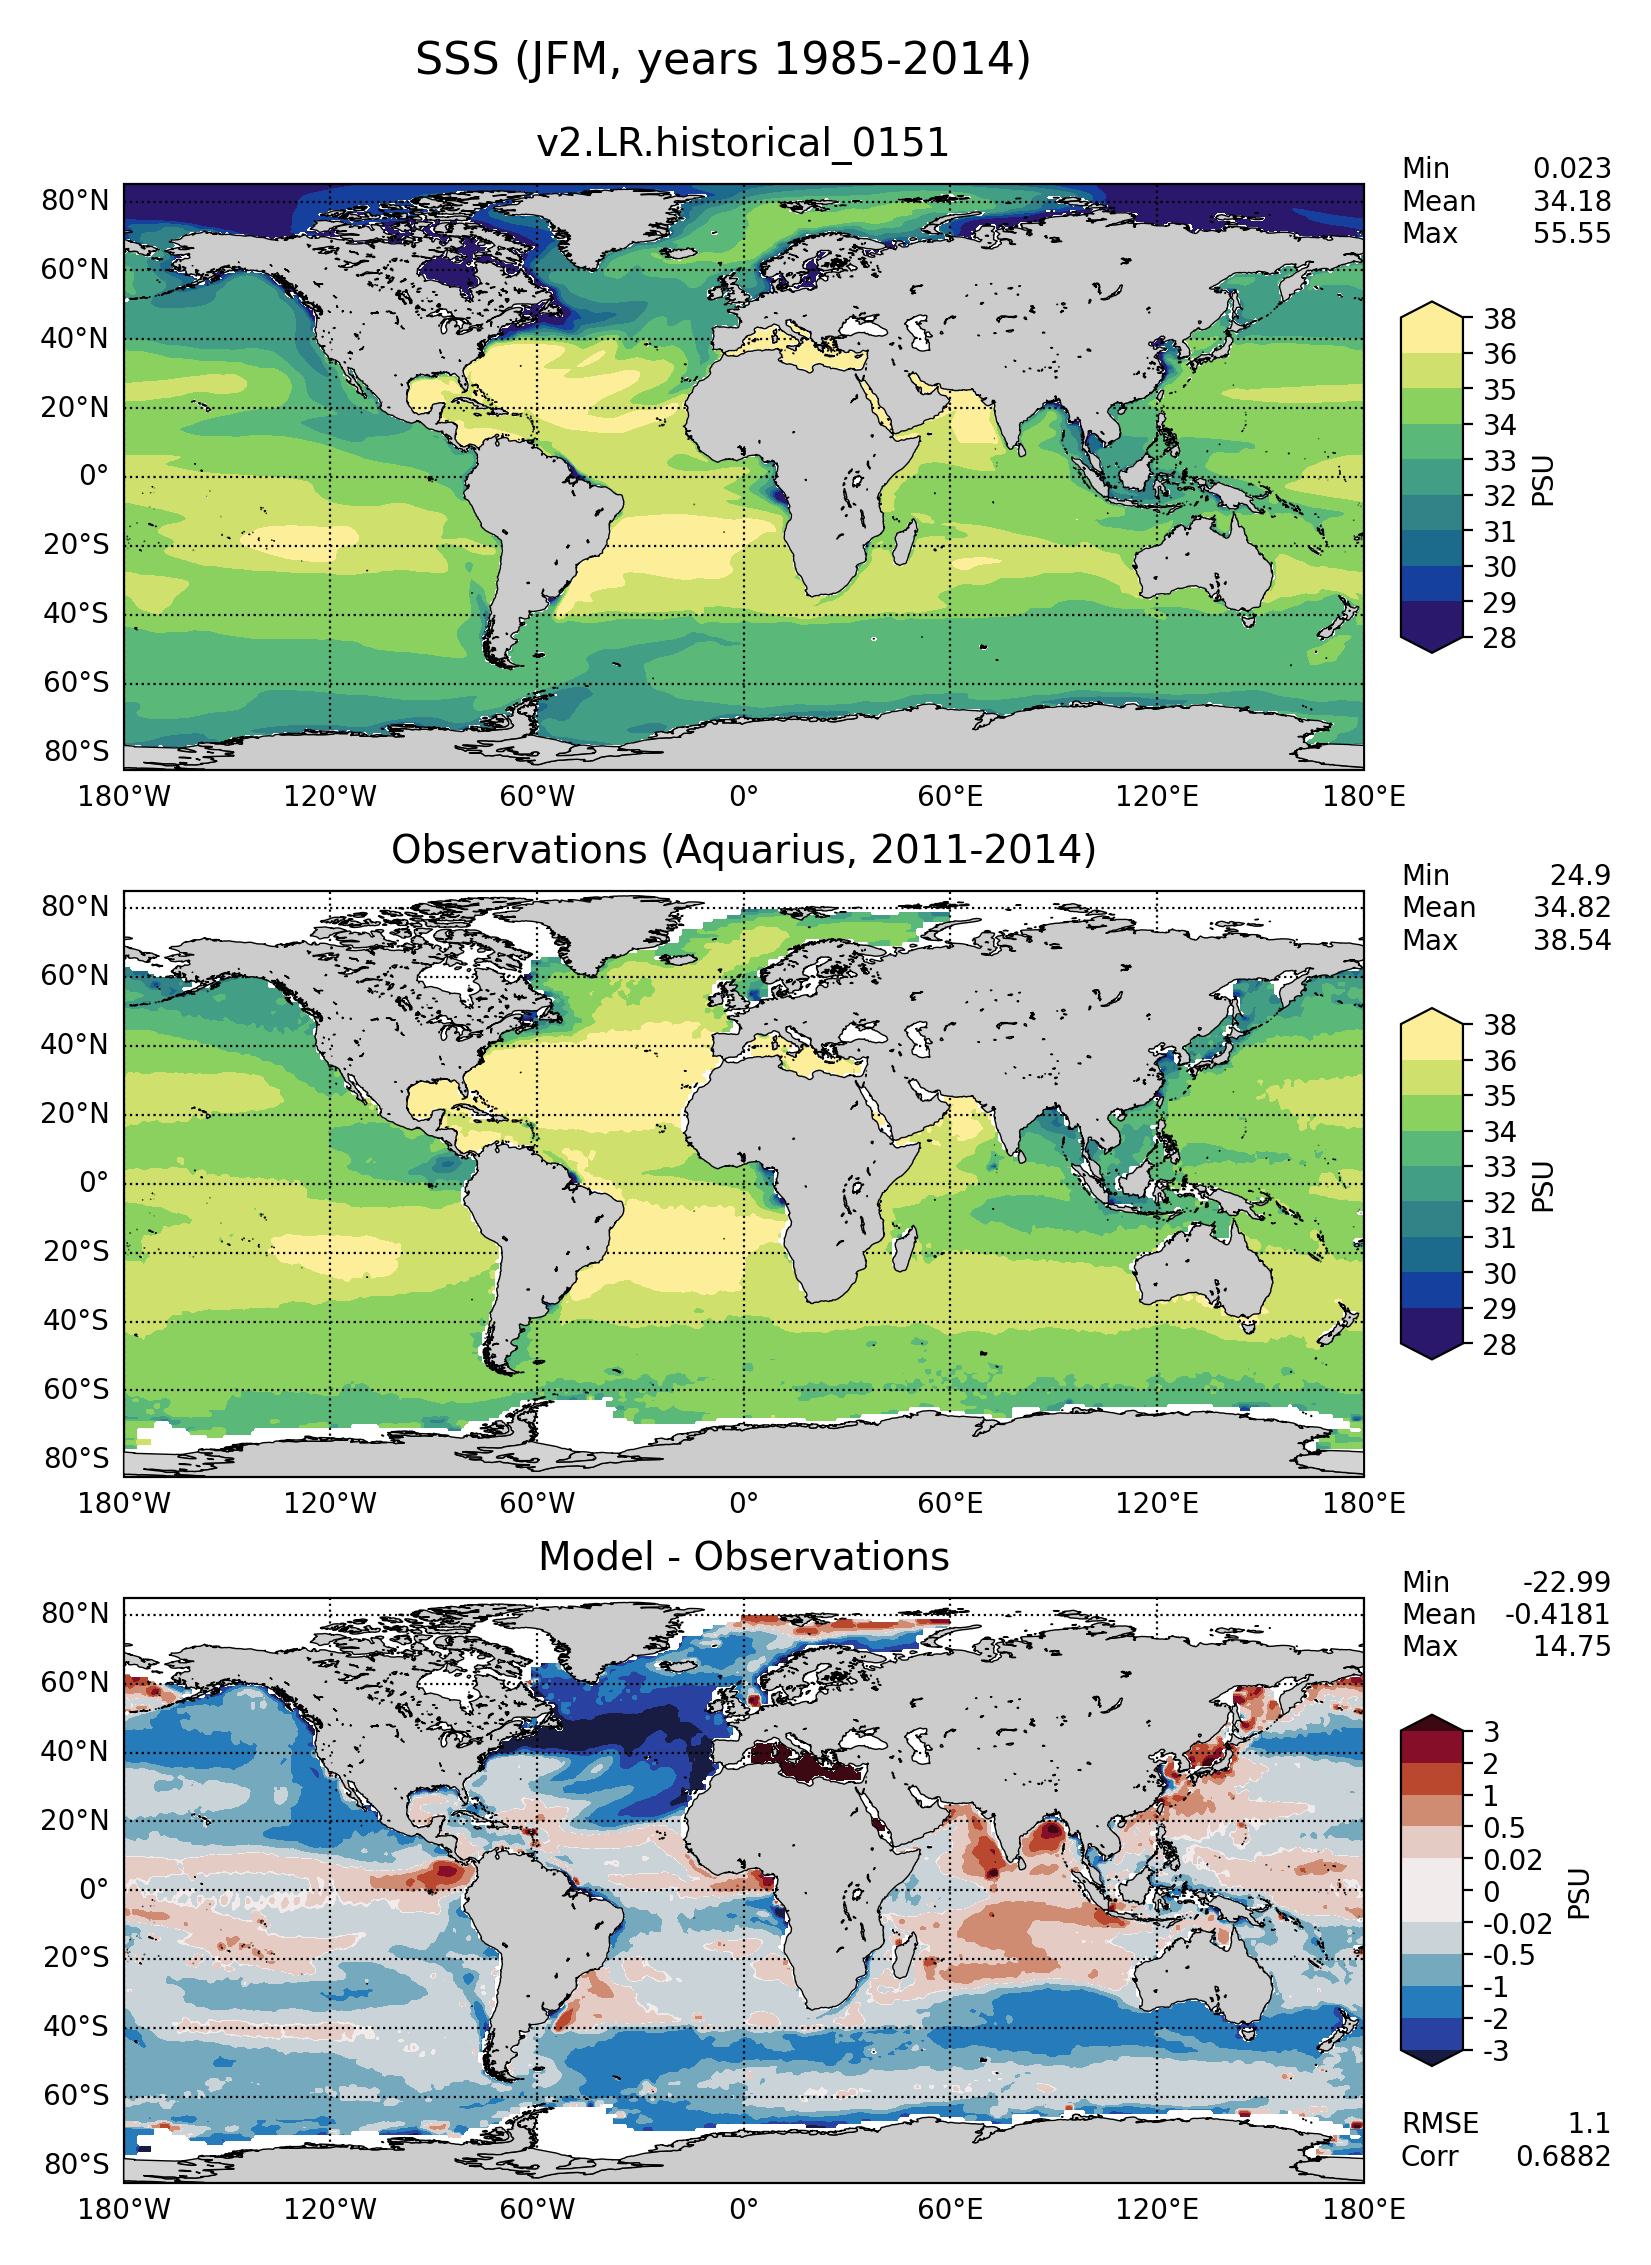
JFM
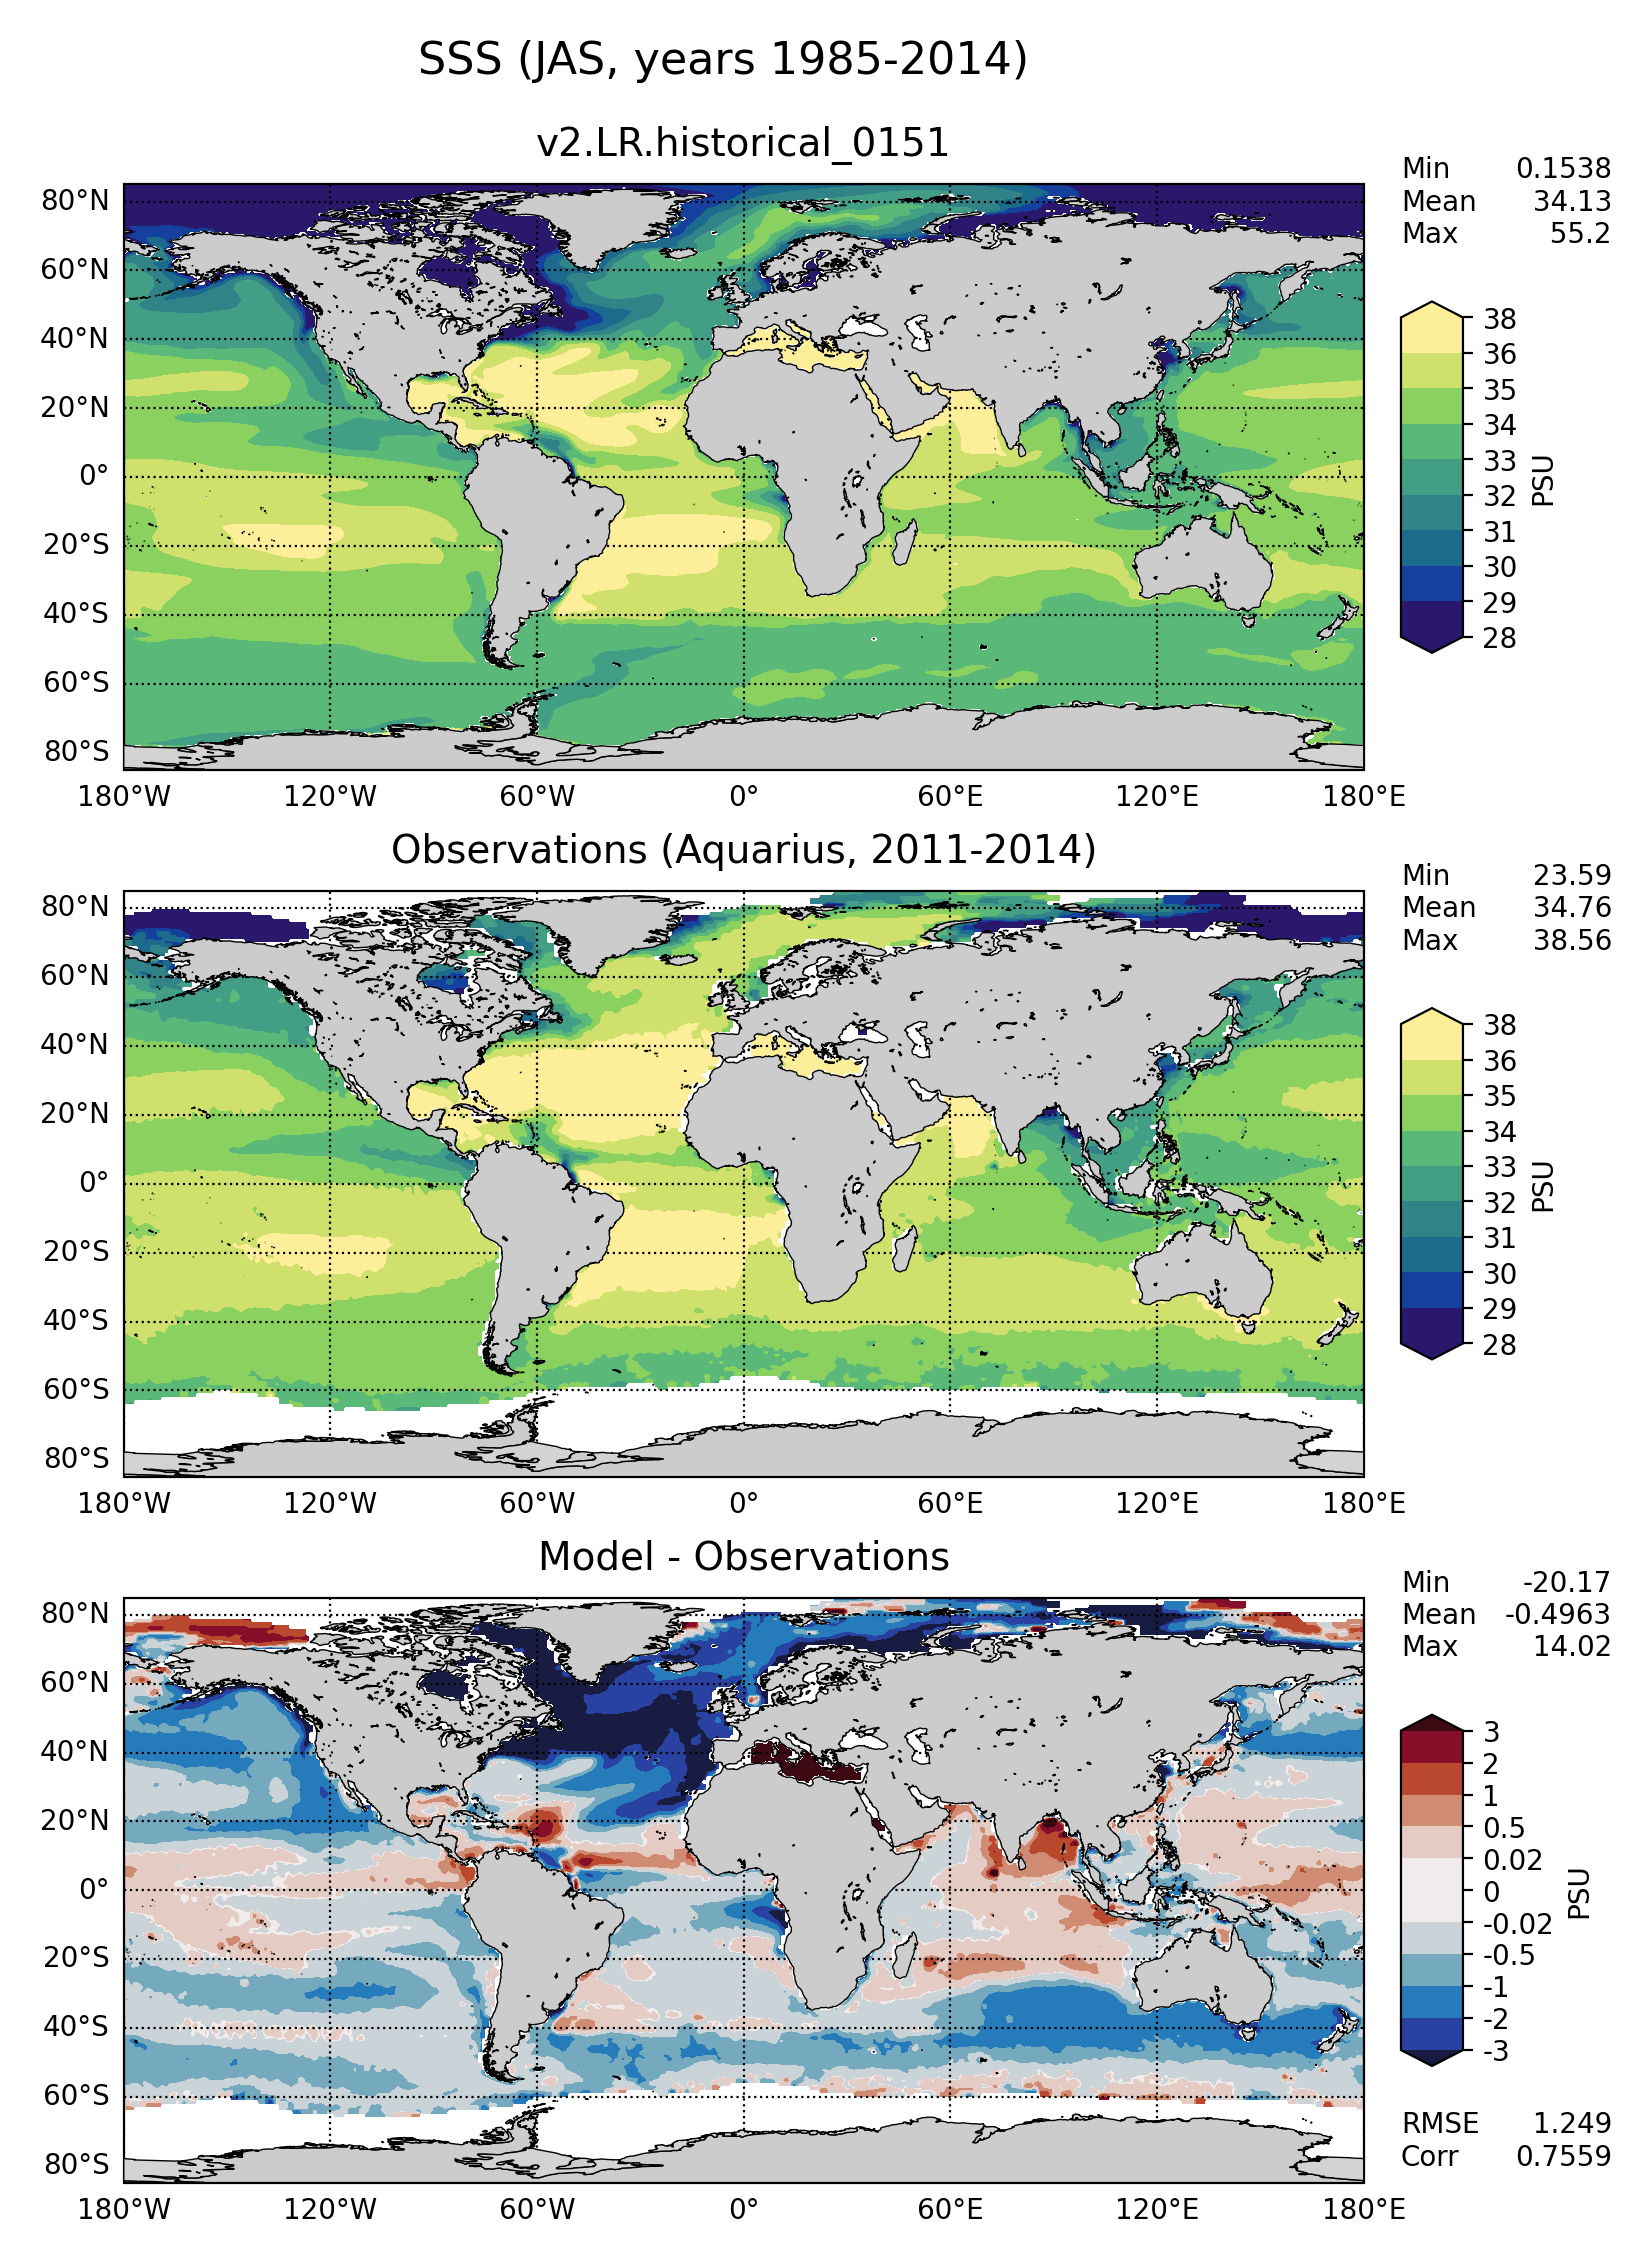
JAS
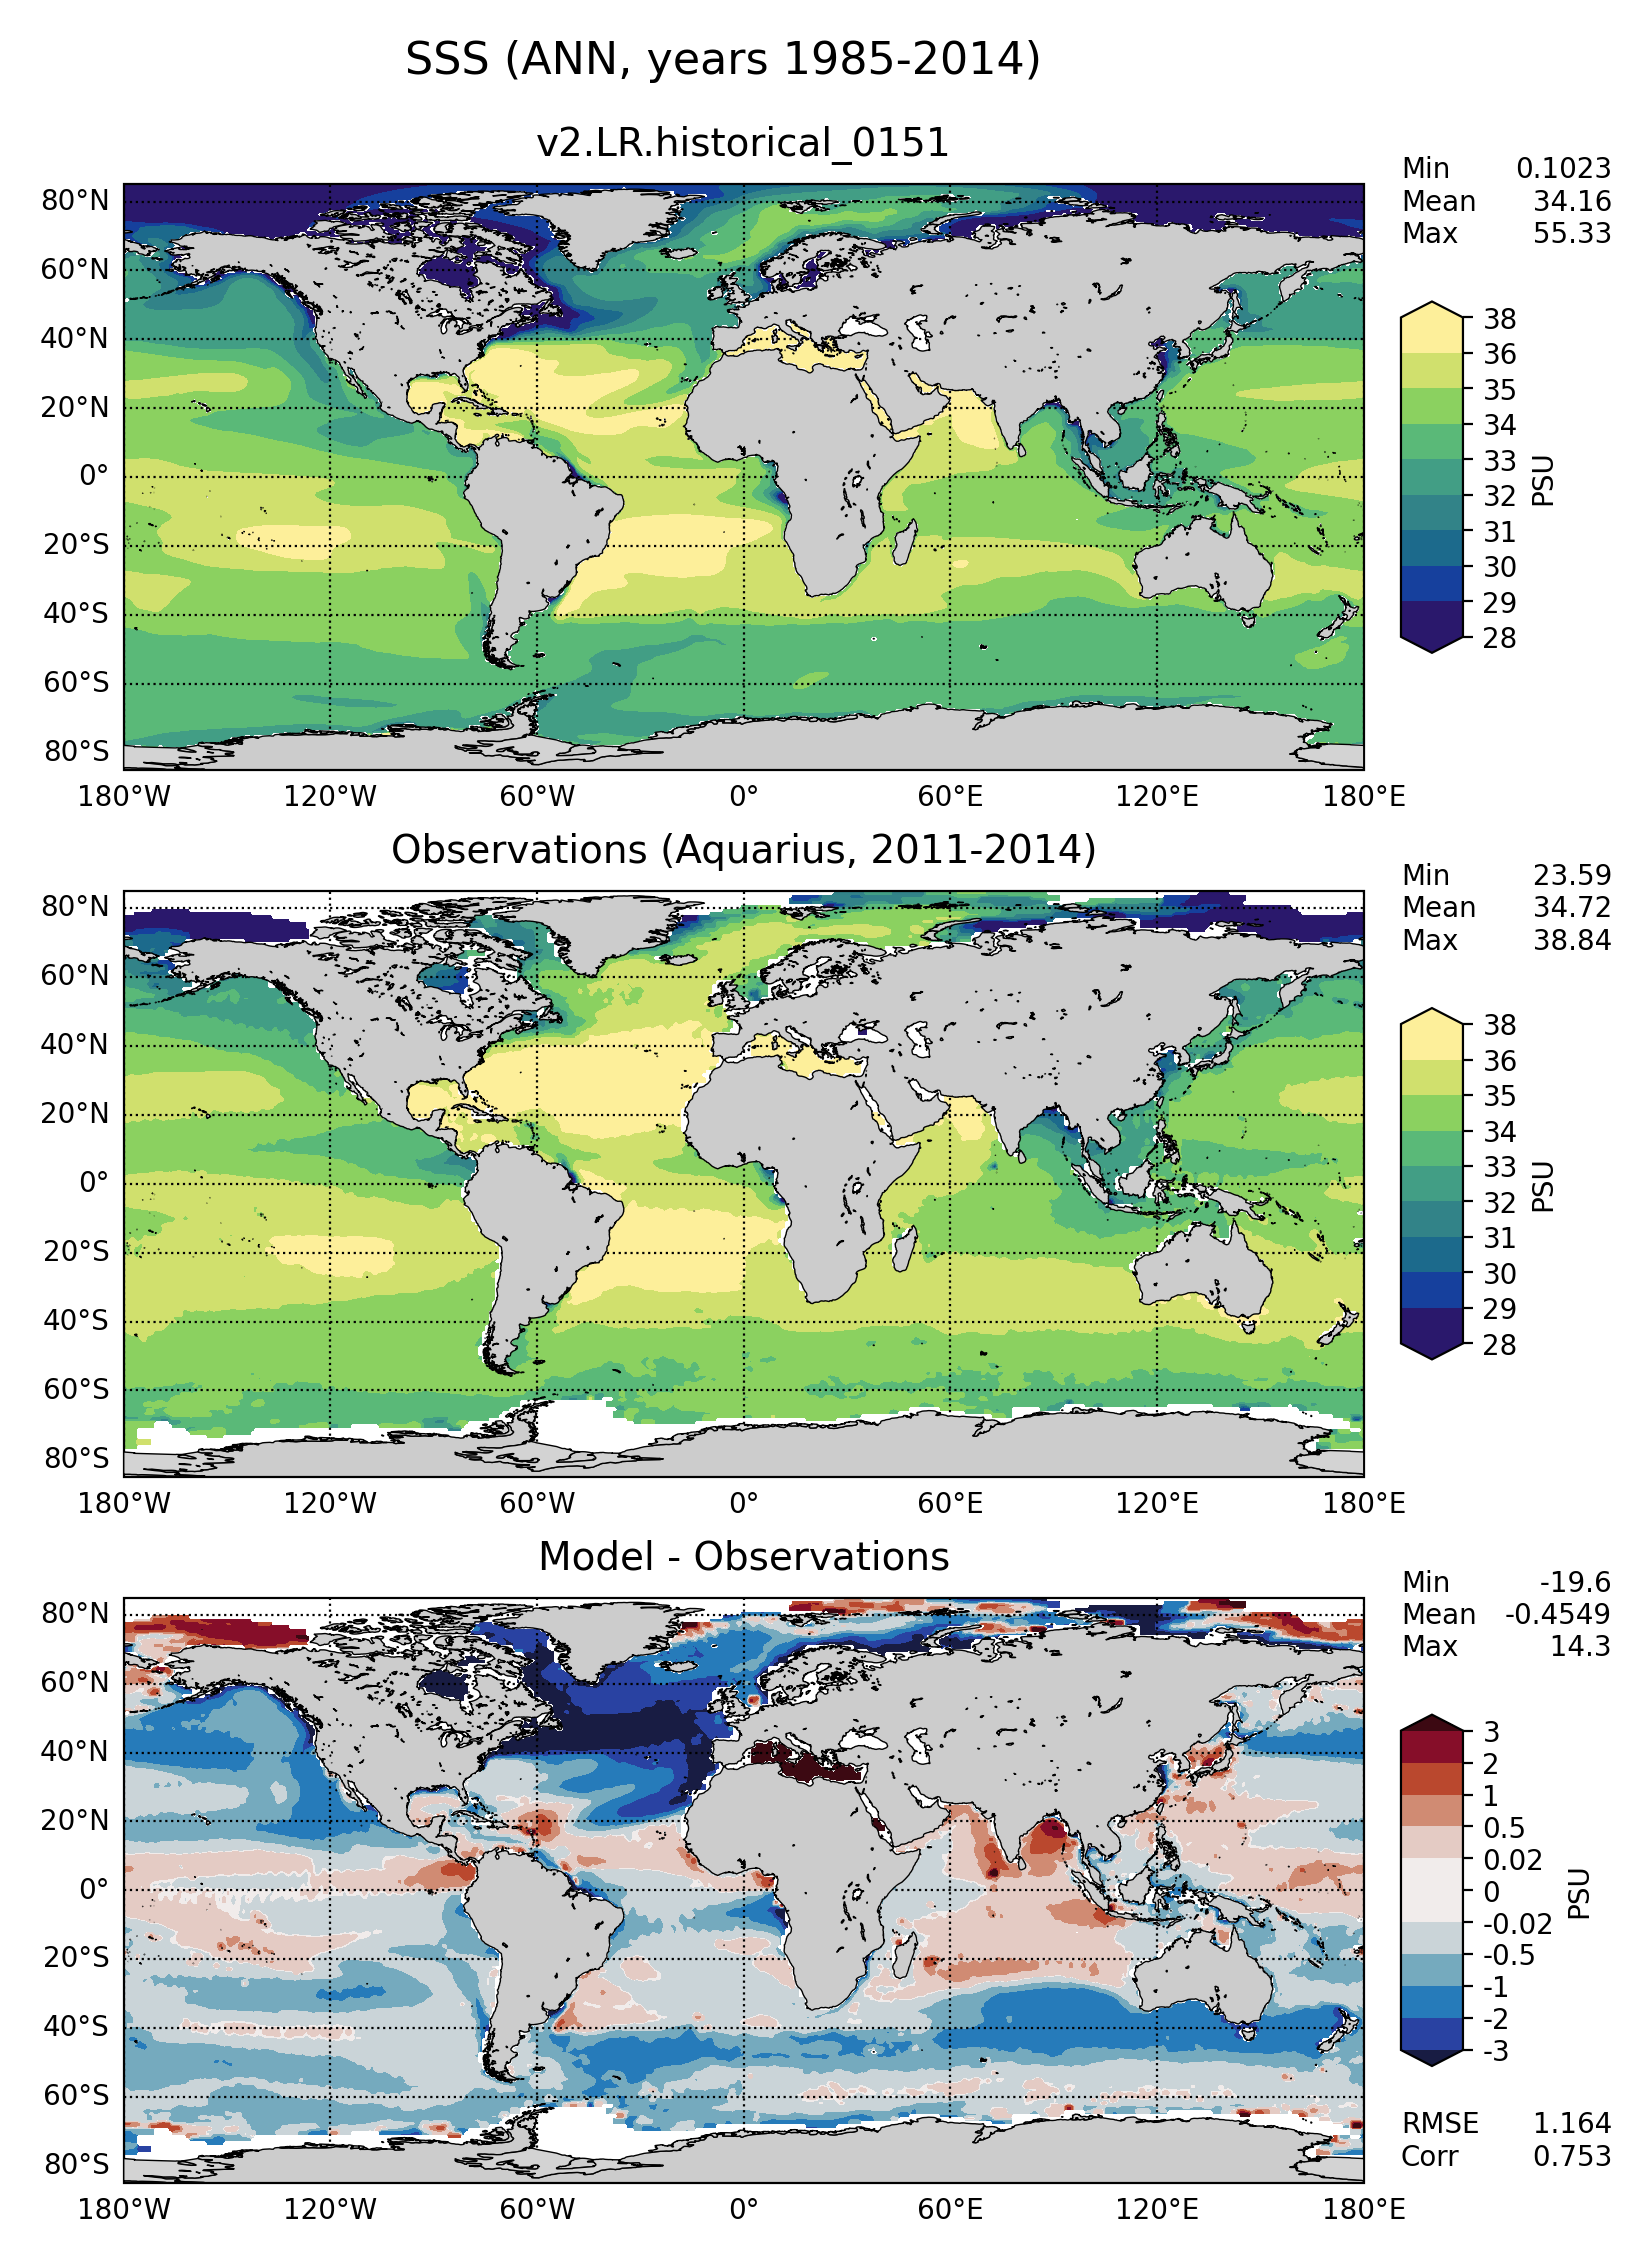
ANN
Observations: AVISO
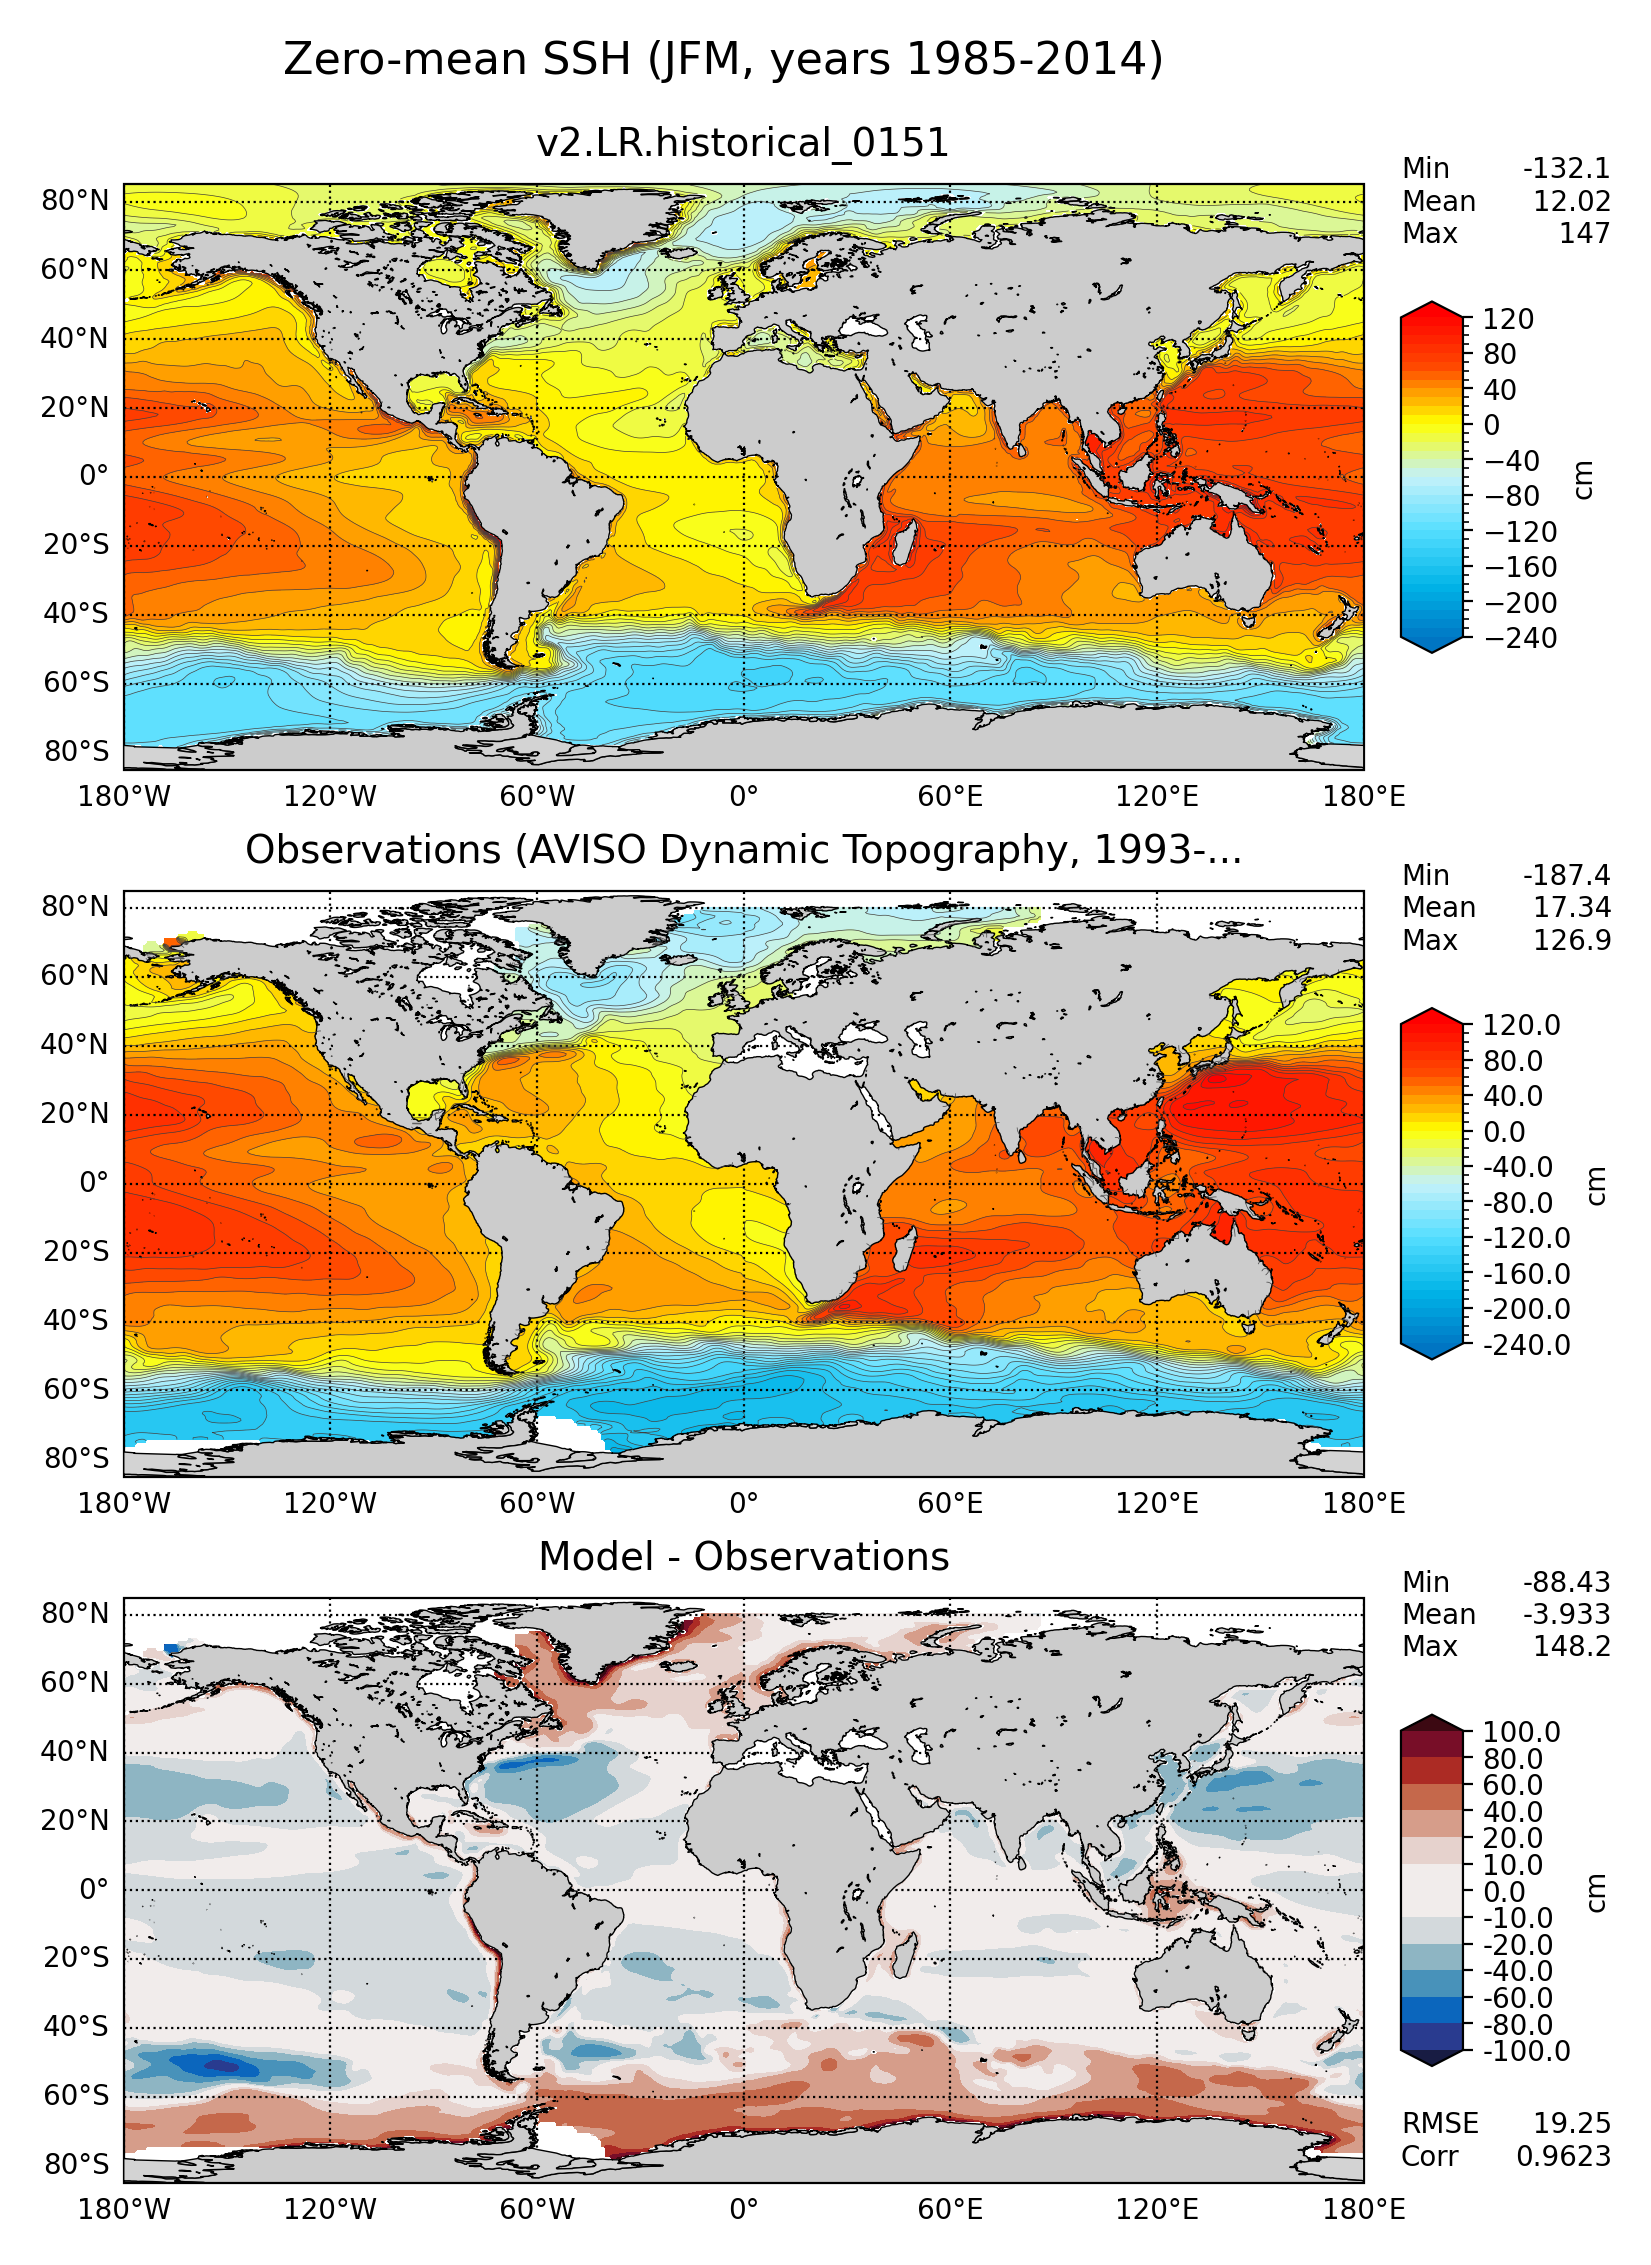
JFM
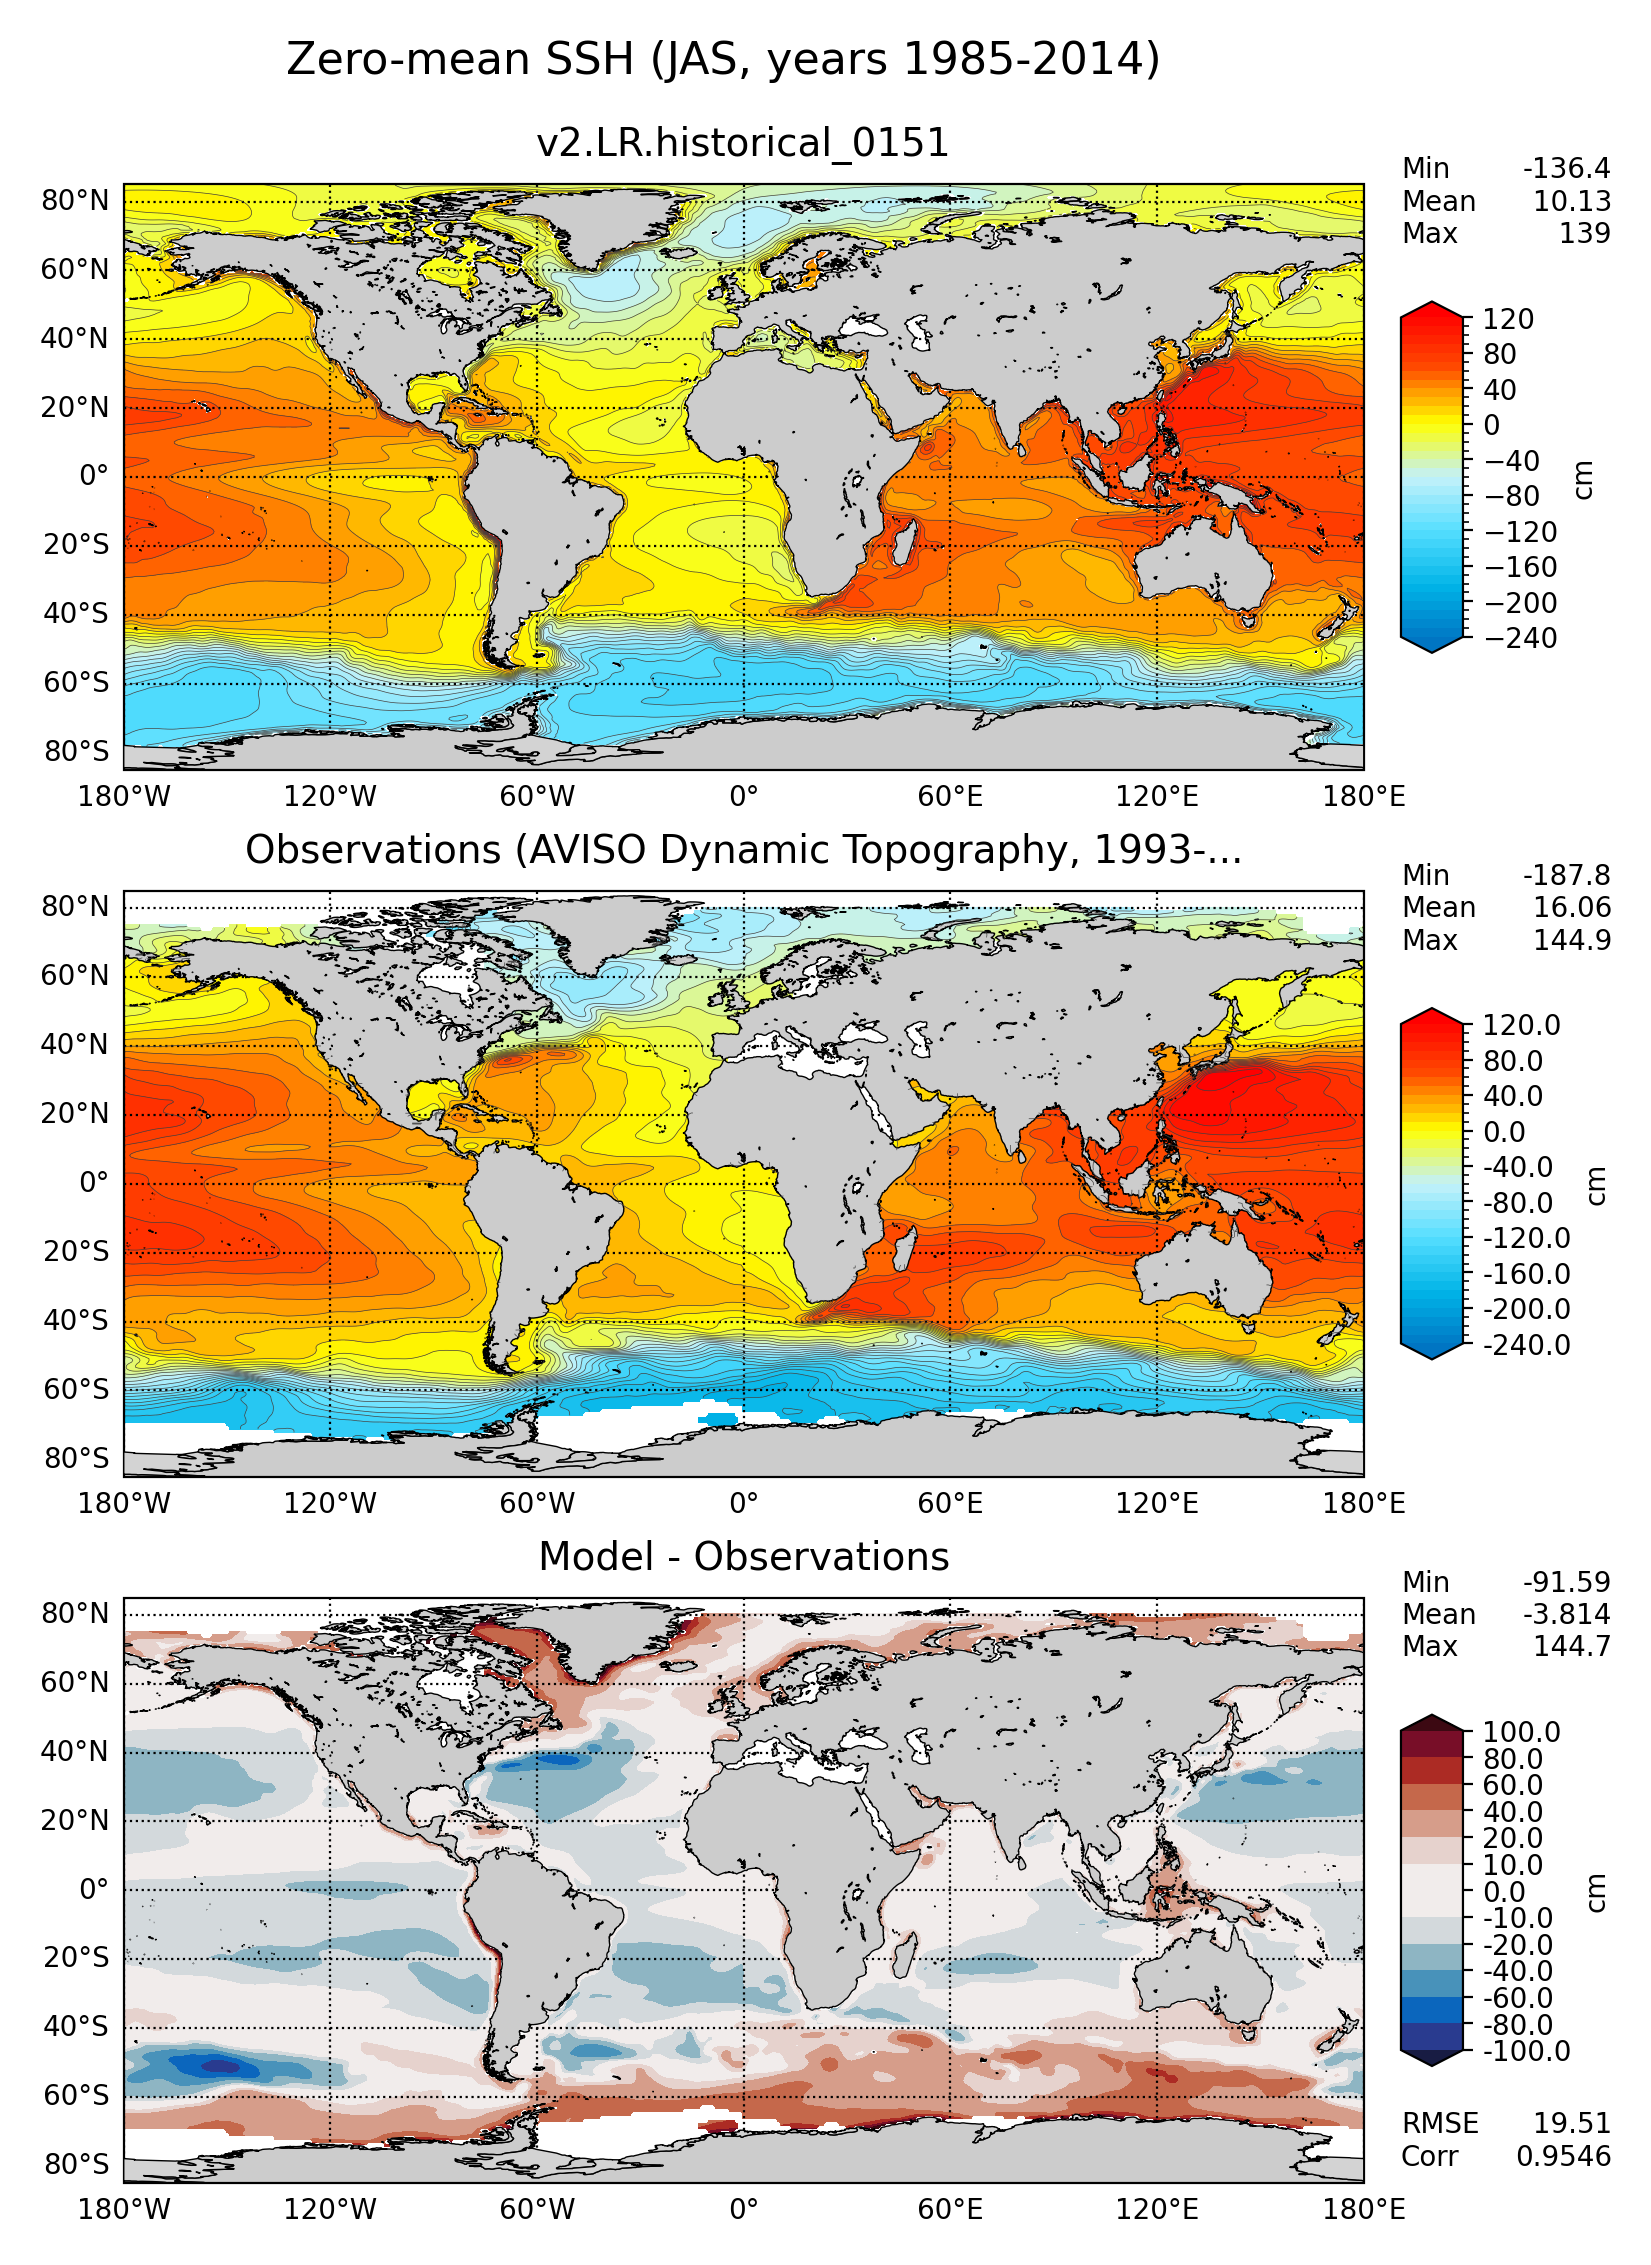
JAS
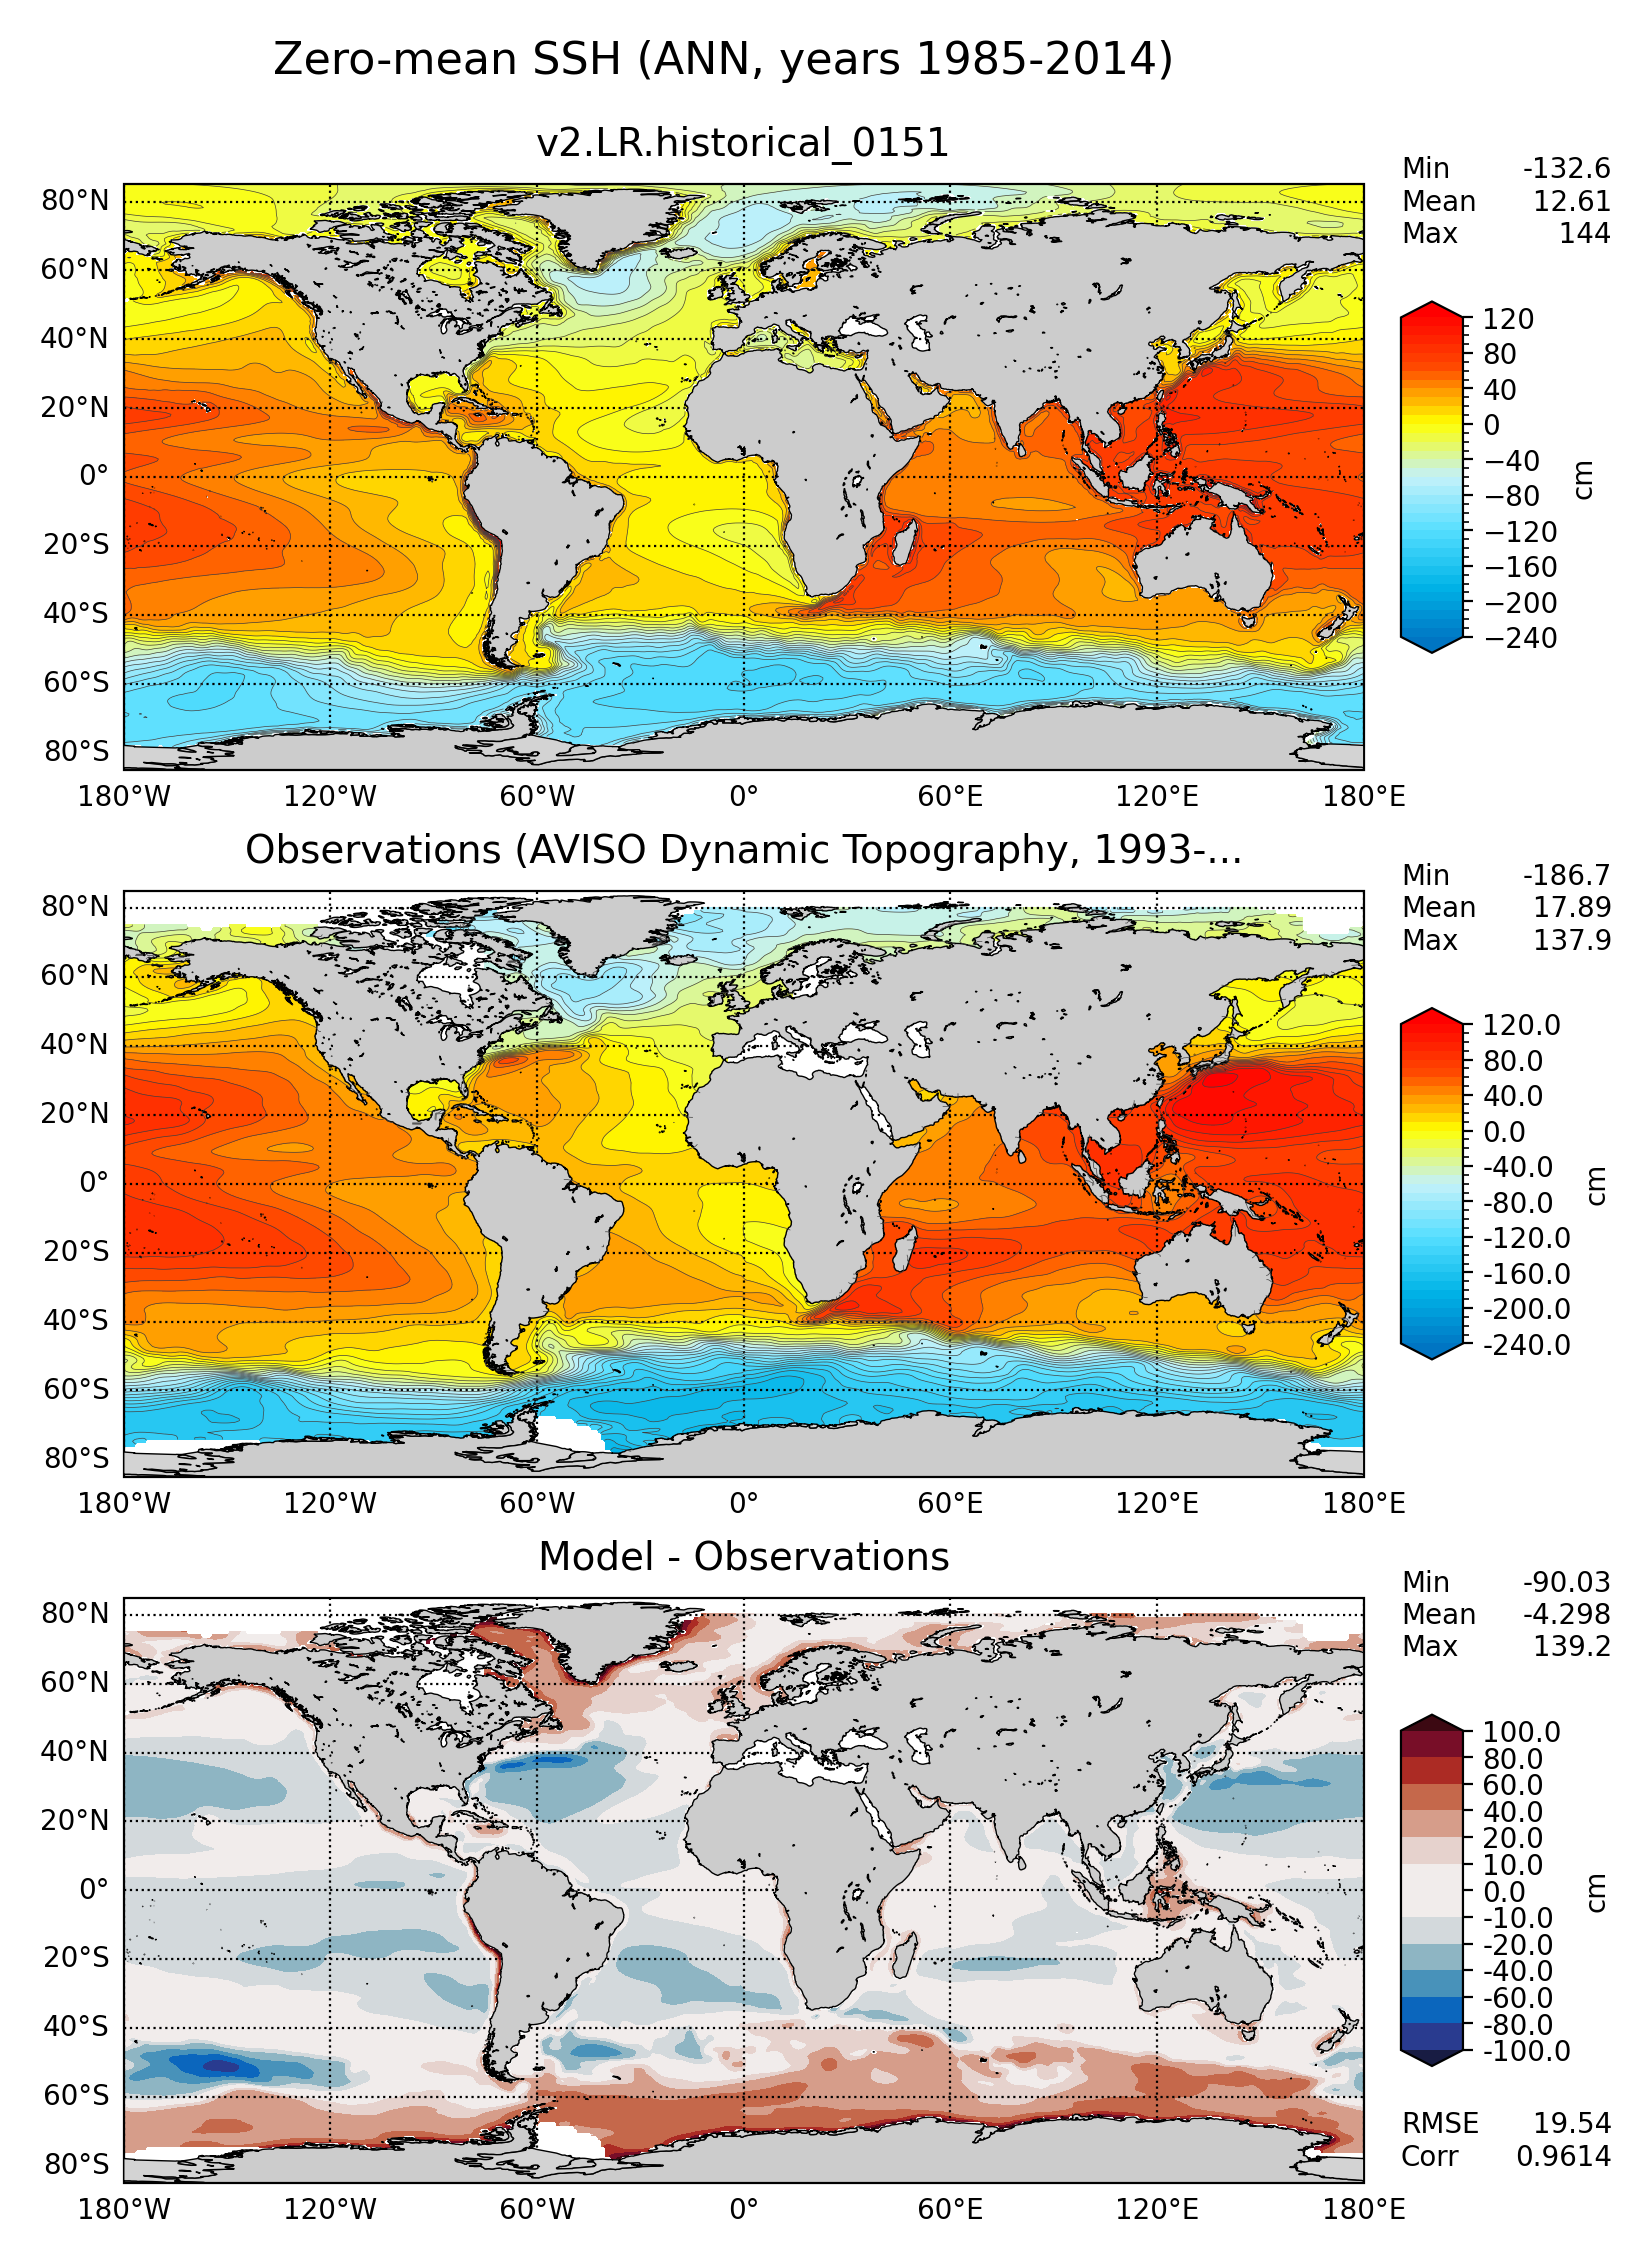
ANN
Observations: EKE from Drifters
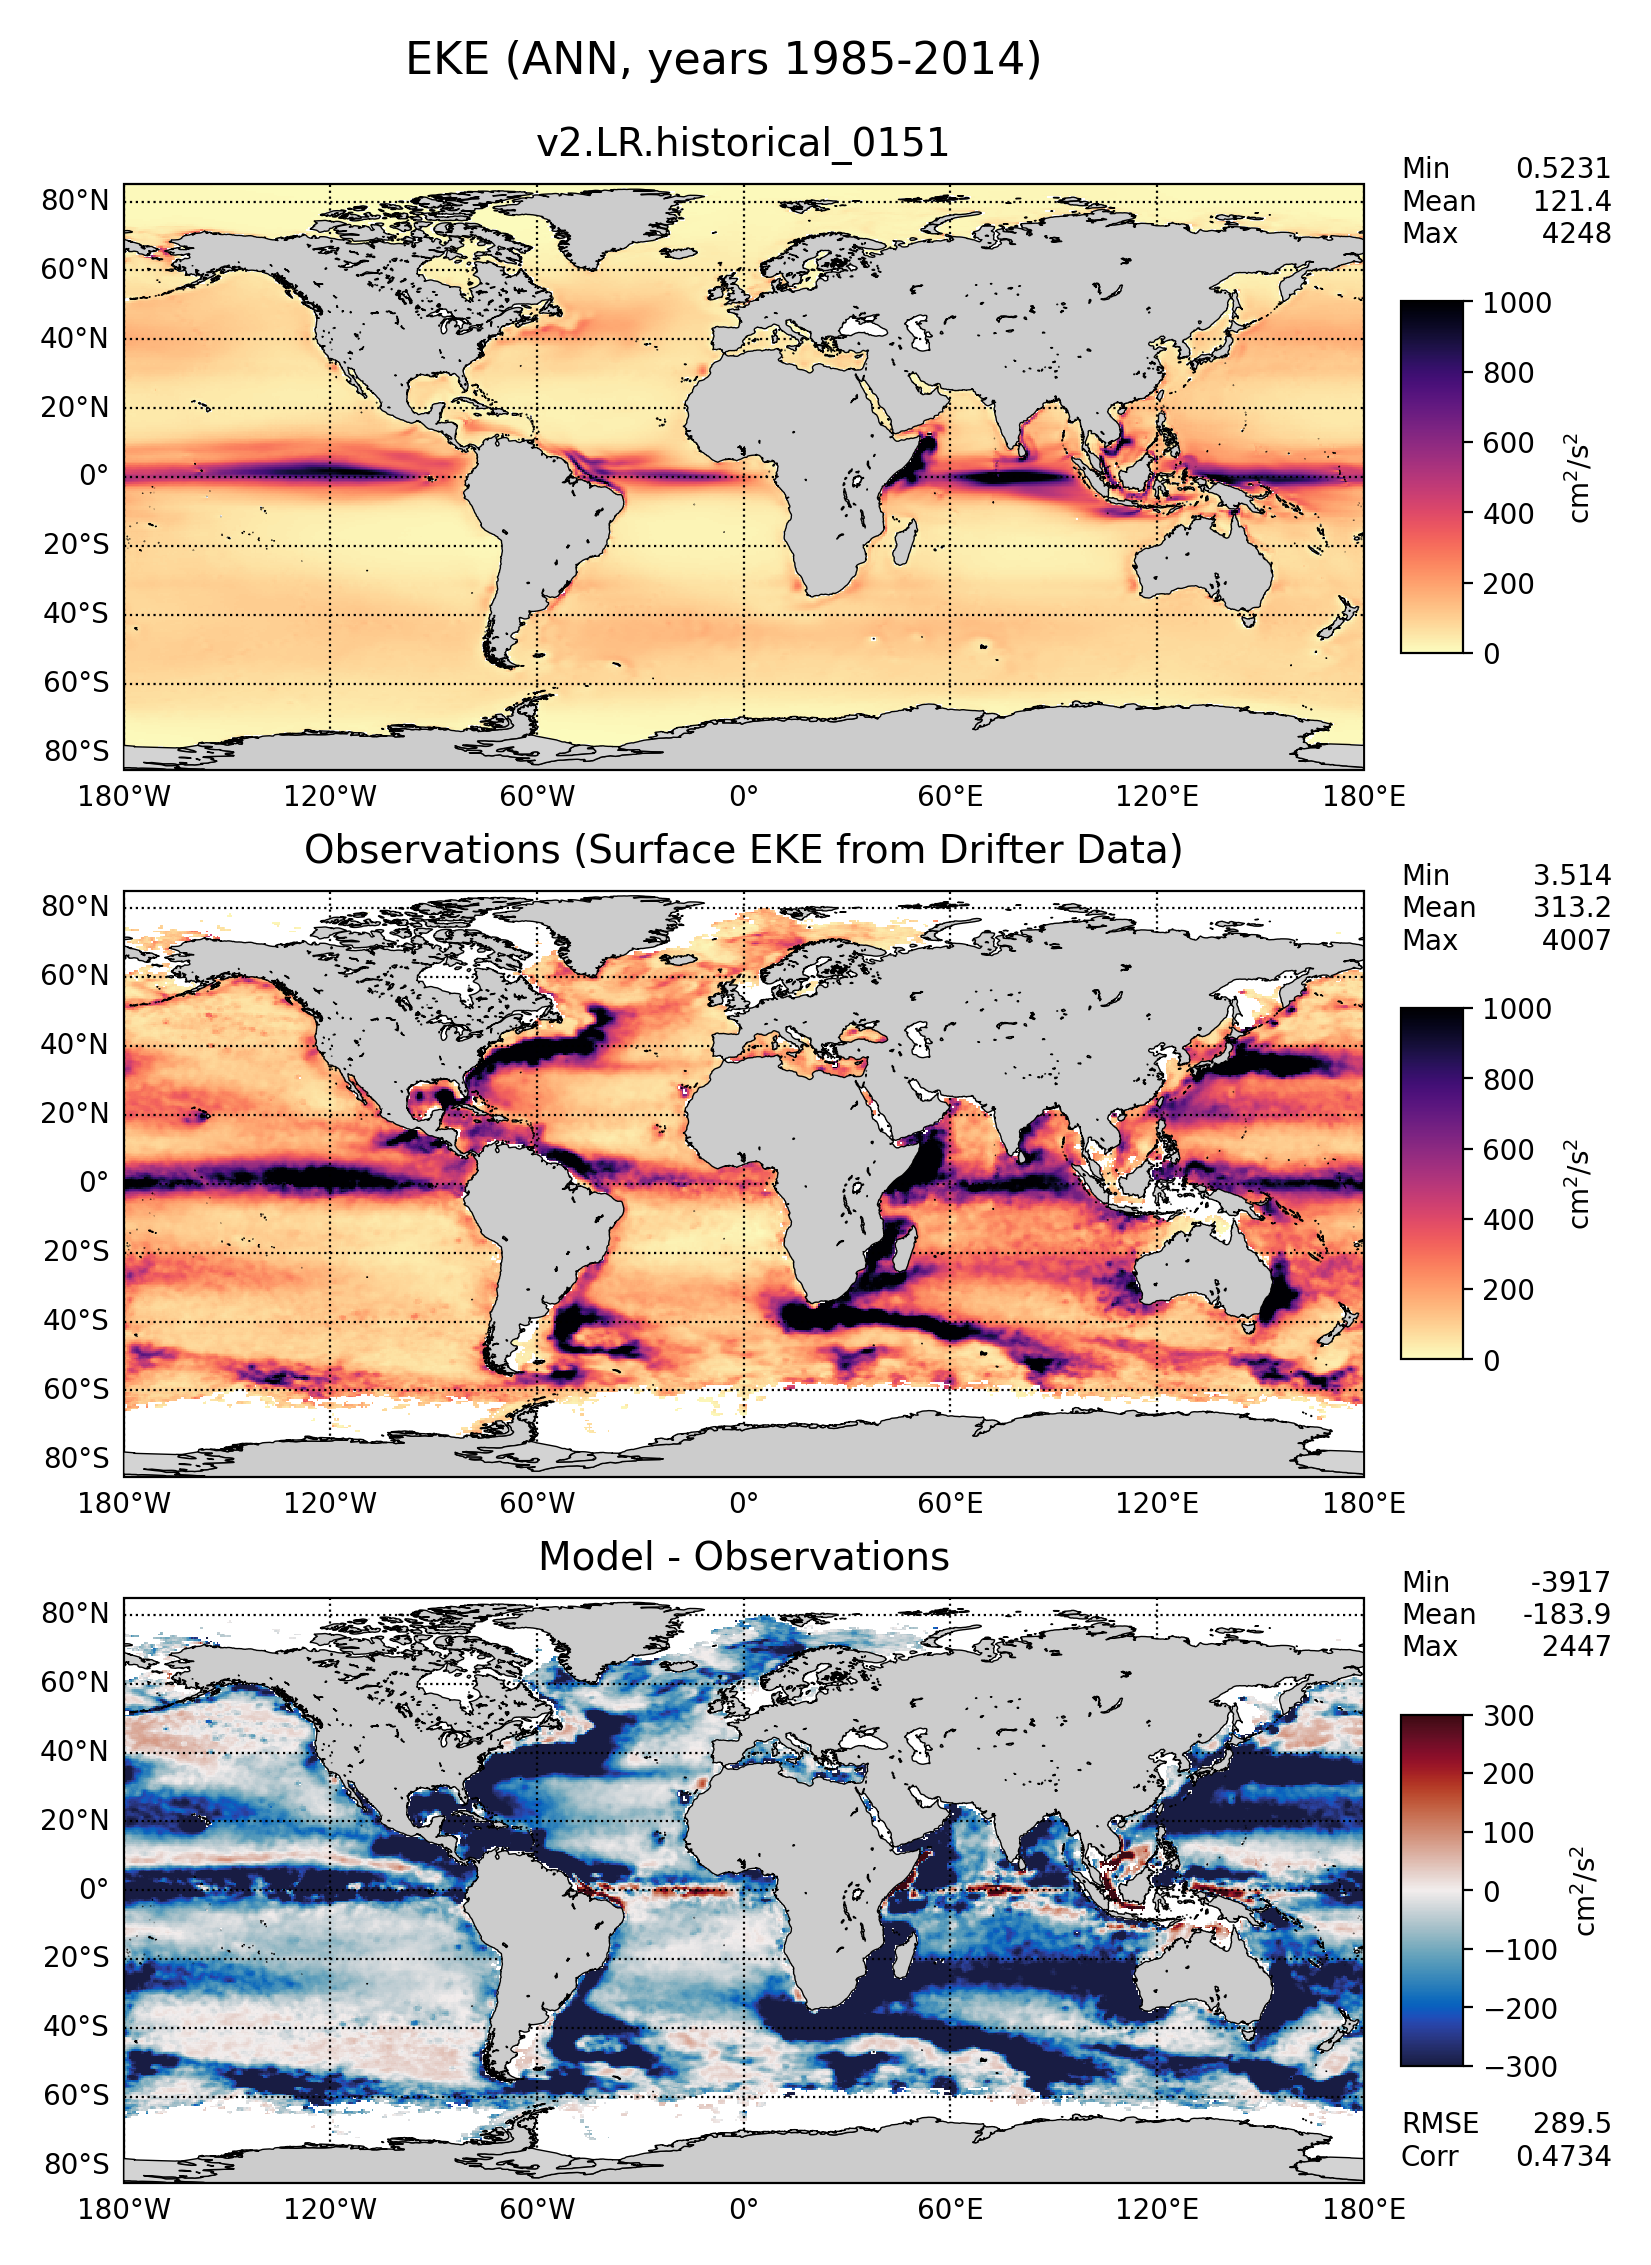
ANN
Observations: EKE from Drifters

ANN
ANN

ANN

ANN

ANN
State Estimate: SOSE

ANN surface

JFM surface

JAS surface

ANN z=-200 m

JFM z=-200 m

JAS z=-200 m

ANN z=-400 m

JFM z=-400 m

JAS z=-400 m

ANN z=-600 m

JFM z=-600 m

JAS z=-600 m

ANN z=-800 m

JFM z=-800 m

JAS z=-800 m

ANN floor

JFM floor

JAS floor
State Estimate: SOSE

ANN surface

JFM surface

JAS surface

ANN z=-200 m

JFM z=-200 m

JAS z=-200 m

ANN z=-400 m

JFM z=-400 m

JAS z=-400 m

ANN z=-600 m

JFM z=-600 m

JAS z=-600 m

ANN z=-800 m

JFM z=-800 m

JAS z=-800 m

ANN floor

JFM floor

JAS floor
State Estimate: SOSE

ANN surface

JFM surface

JAS surface

ANN z=-200 m

JFM z=-200 m

JAS z=-200 m

ANN z=-400 m

JFM z=-400 m

JAS z=-400 m

ANN z=-600 m

JFM z=-600 m

JAS z=-600 m

ANN z=-800 m

JFM z=-800 m

JAS z=-800 m

ANN floor

JFM floor

JAS floor
State Estimate: SOSE

ANN

JFM

JAS
State Estimate: SOSE

ANN surface

JFM surface

JAS surface

ANN z=-200 m

JFM z=-200 m

JAS z=-200 m

ANN z=-400 m

JFM z=-400 m

JAS z=-400 m

ANN z=-600 m

JFM z=-600 m

JAS z=-600 m

ANN z=-800 m

JFM z=-800 m

JAS z=-800 m

ANN floor

JFM floor

JAS floor
State Estimate: SOSE

ANN surface

JFM surface

JAS surface

ANN z=-200 m

JFM z=-200 m

JAS z=-200 m

ANN z=-400 m

JFM z=-400 m

JAS z=-400 m

ANN z=-600 m

JFM z=-600 m

JAS z=-600 m

ANN z=-800 m

JFM z=-800 m

JAS z=-800 m

ANN floor

JFM floor

JAS floor
State Estimate: SOSE

ANN surface

JFM surface

JAS surface

ANN z=-200 m

JFM z=-200 m

JAS z=-200 m

ANN z=-400 m

JFM z=-400 m

JAS z=-400 m

ANN z=-600 m

JFM z=-600 m

JAS z=-600 m

ANN z=-800 m

JFM z=-800 m

JAS z=-800 m

ANN floor

JFM floor

JAS floor
WOA23 Climatology

ANN surface

JFM surface

JAS surface

ANN z=-500 m

JFM z=-500 m

JAS z=-500 m

ANN z=-1000 m

JFM z=-1000 m

JAS z=-1000 m
WOA23 Climatology

ANN surface

JFM surface

JAS surface

ANN z=-500 m

JFM z=-500 m

JAS z=-500 m

ANN z=-1000 m

JFM z=-1000 m

JAS z=-1000 m
Roemmich-Gilson Climatology: Argo

ANN surface

ANN z=-25 m

ANN z=-50 m

ANN z=-100 m

ANN z=-150 m

ANN z=-200 m

ANN z=-400 m

ANN z=-800 m

ANN z=-1500 m

JAS surface

JAS z=-25 m

JAS z=-50 m

JAS z=-100 m

JAS z=-150 m

JAS z=-200 m

JAS z=-400 m

JAS z=-800 m

JAS z=-1500 m

JFM surface

JFM z=-25 m

JFM z=-50 m

JFM z=-100 m

JFM z=-150 m

JFM z=-200 m

JFM z=-400 m

JFM z=-800 m

JFM z=-1500 m
Ocean Basins
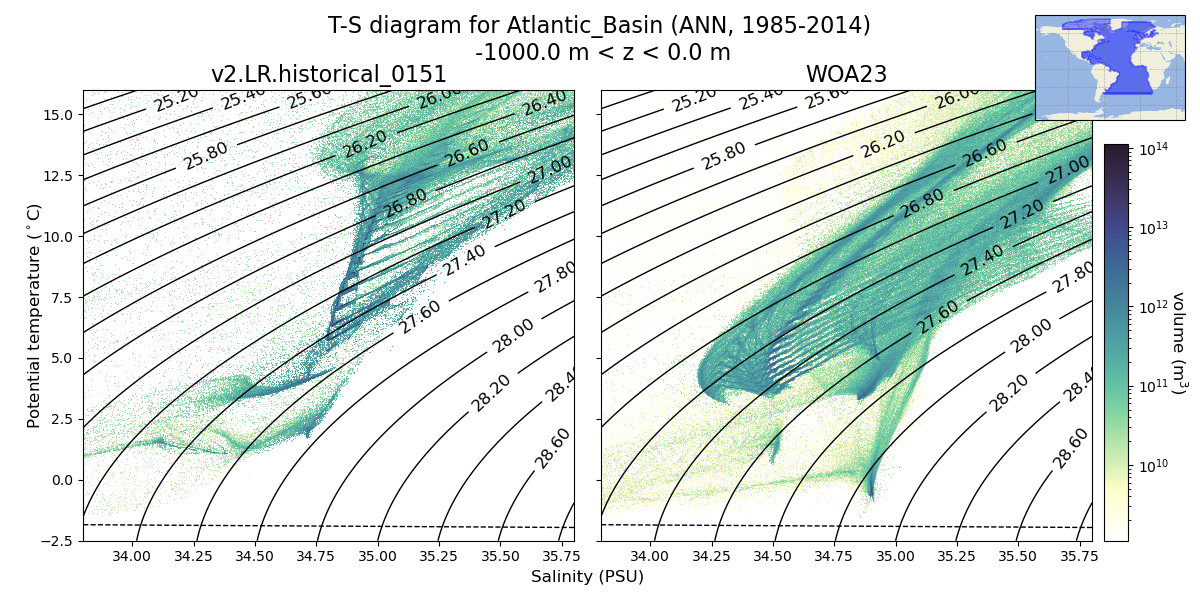
Atlantic_Basin
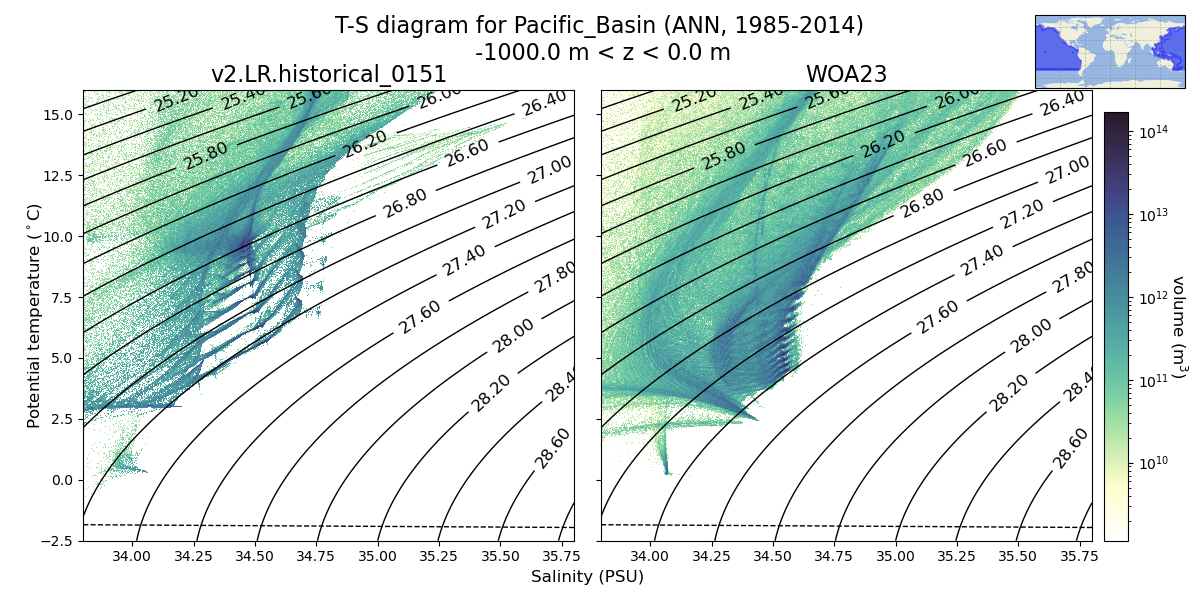
Pacific_Basin
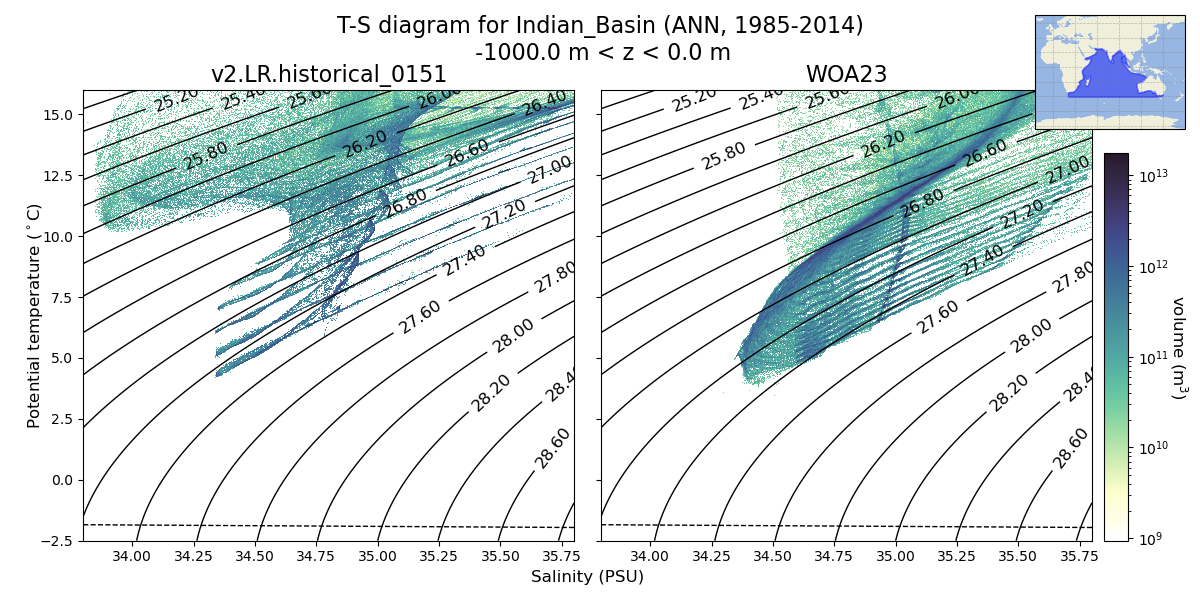
Indian_Basin
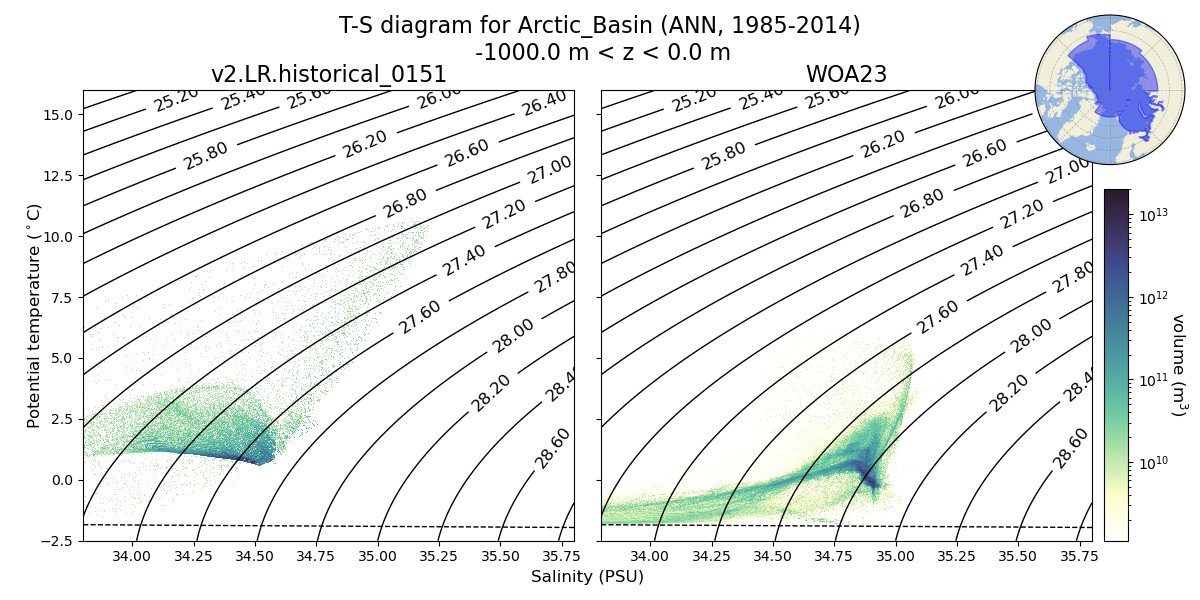
Arctic_Basin

Southern_Ocean_Basin
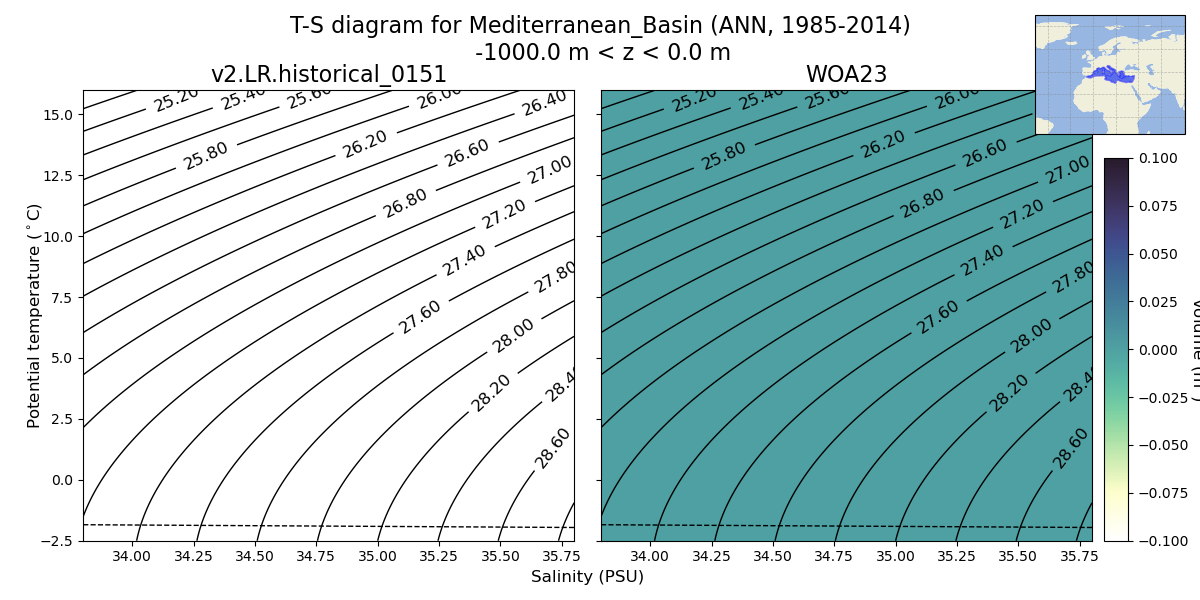
Mediterranean_Basin
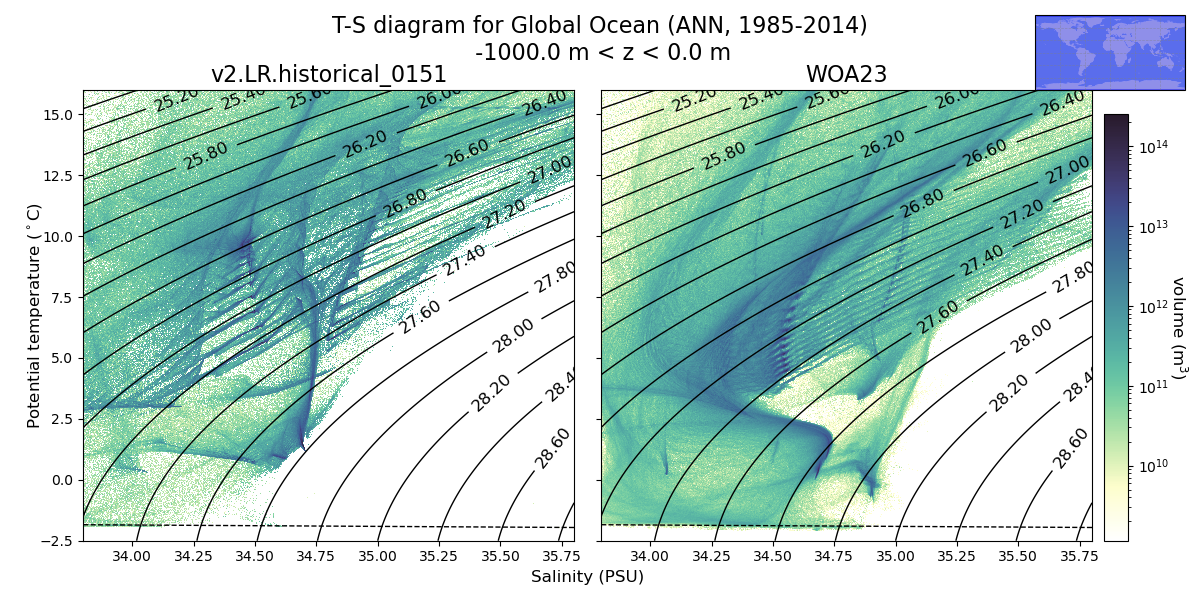
Global Ocean
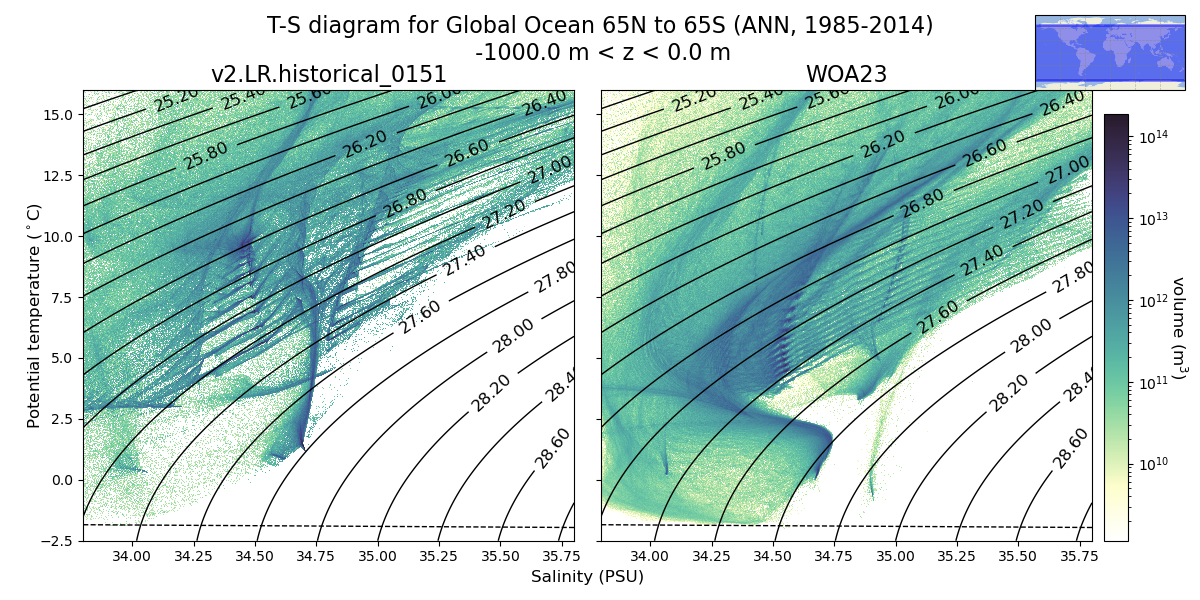
Global Ocean 65N to 65S
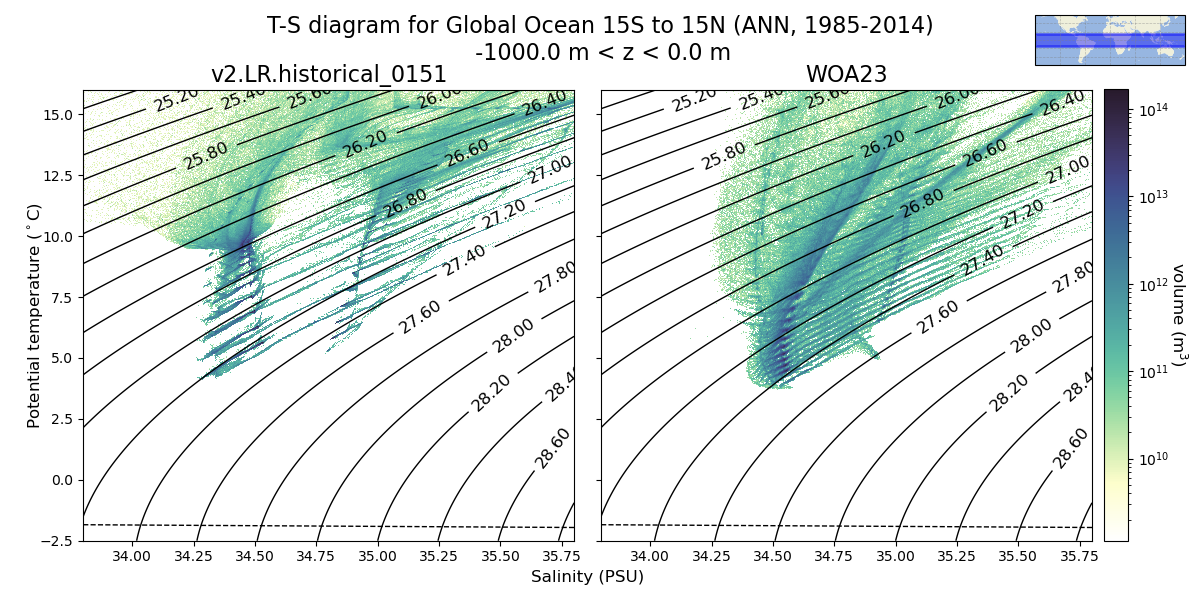
Global Ocean 15S to 15N