 cori-knl.2017-master-dec12.hmod1550t32x4.mdec12.st04.at1.si.nr.nhf.1m.s32.ne120np4_oRRS18to6v3_ICG
 and
OBS data (info)
cori-knl.2017-master-dec12.hmod1550t32x4.mdec12.st04.at1.si.nr.nhf.1m.s32.ne120np4_oRRS18to6v3_ICG
and
OBS data (info)
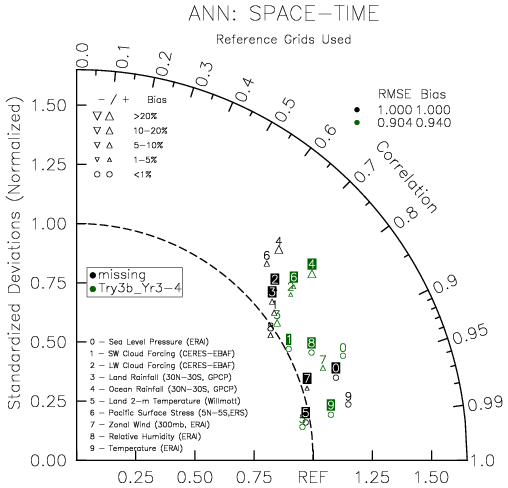
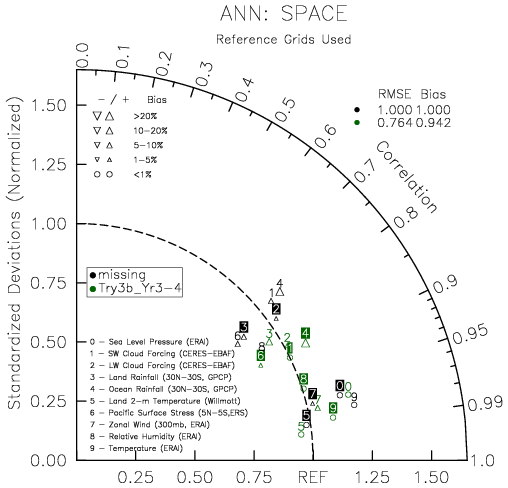
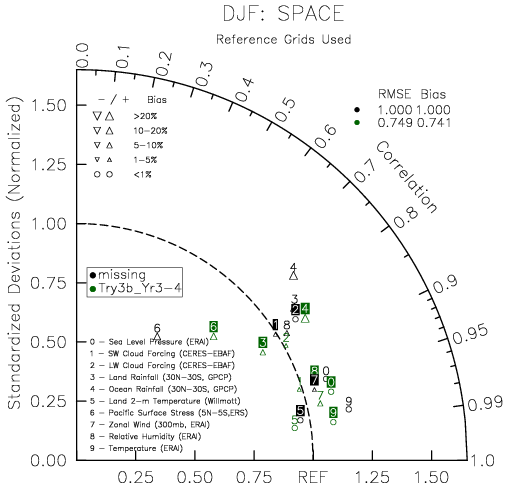
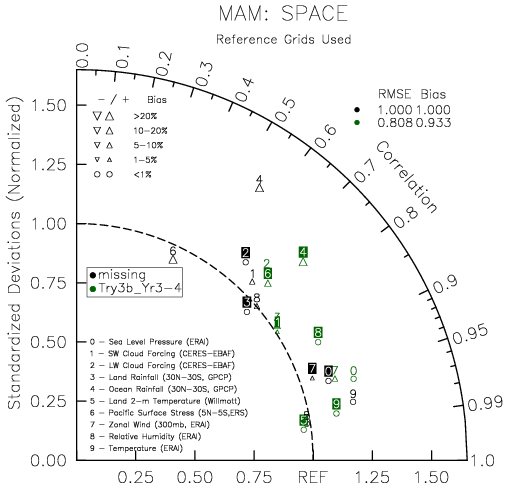
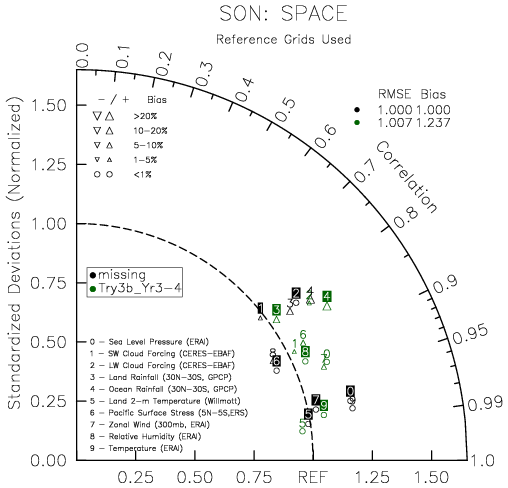
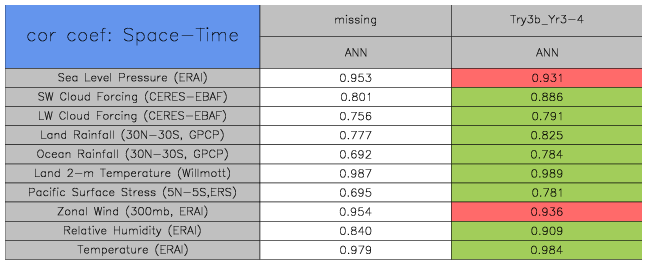
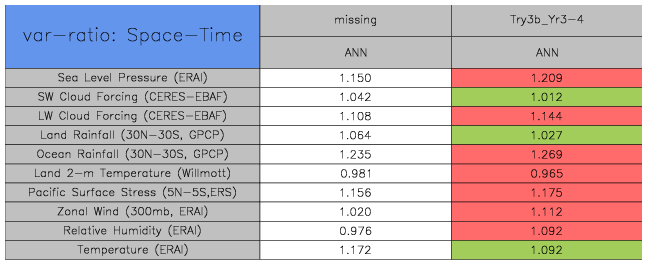
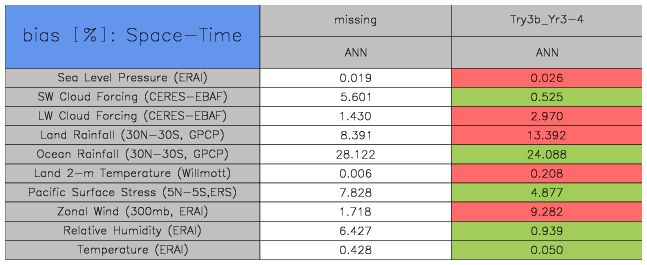
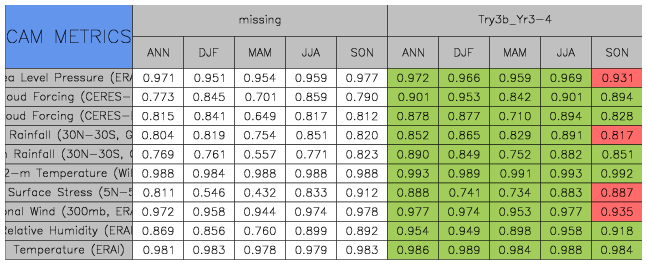
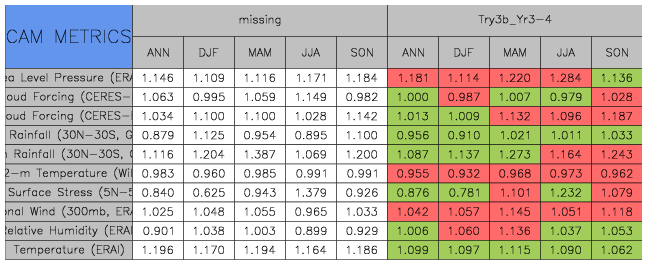
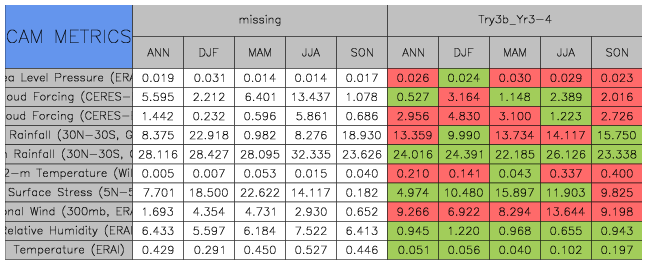
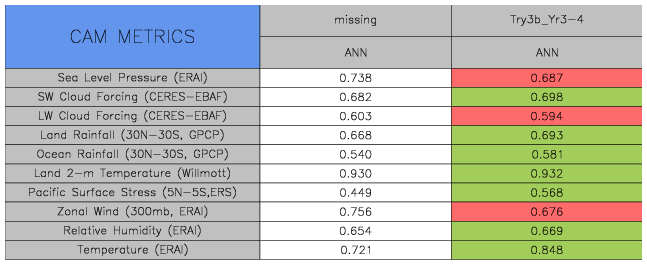
DIAG Set 14 - Taylor Diagrams
Taylor Diagrams were developed by Karl Taylor at PCMDI (paper|tech note) and aim to condense information about variance and RMSE characteristics of a particular model run when compared with observations in a single diagram. The tables summarize the individual metrics for each variable considered including:
| Space and time | ANN | ||||
|---|---|---|---|---|---|
| Space only | ANN | DJF | MAM | JJA | SON |
| Space and time | correlation | variance | bias |
|---|---|---|---|
| Space only | correlation | variancebias | |
| Time only | correlation |