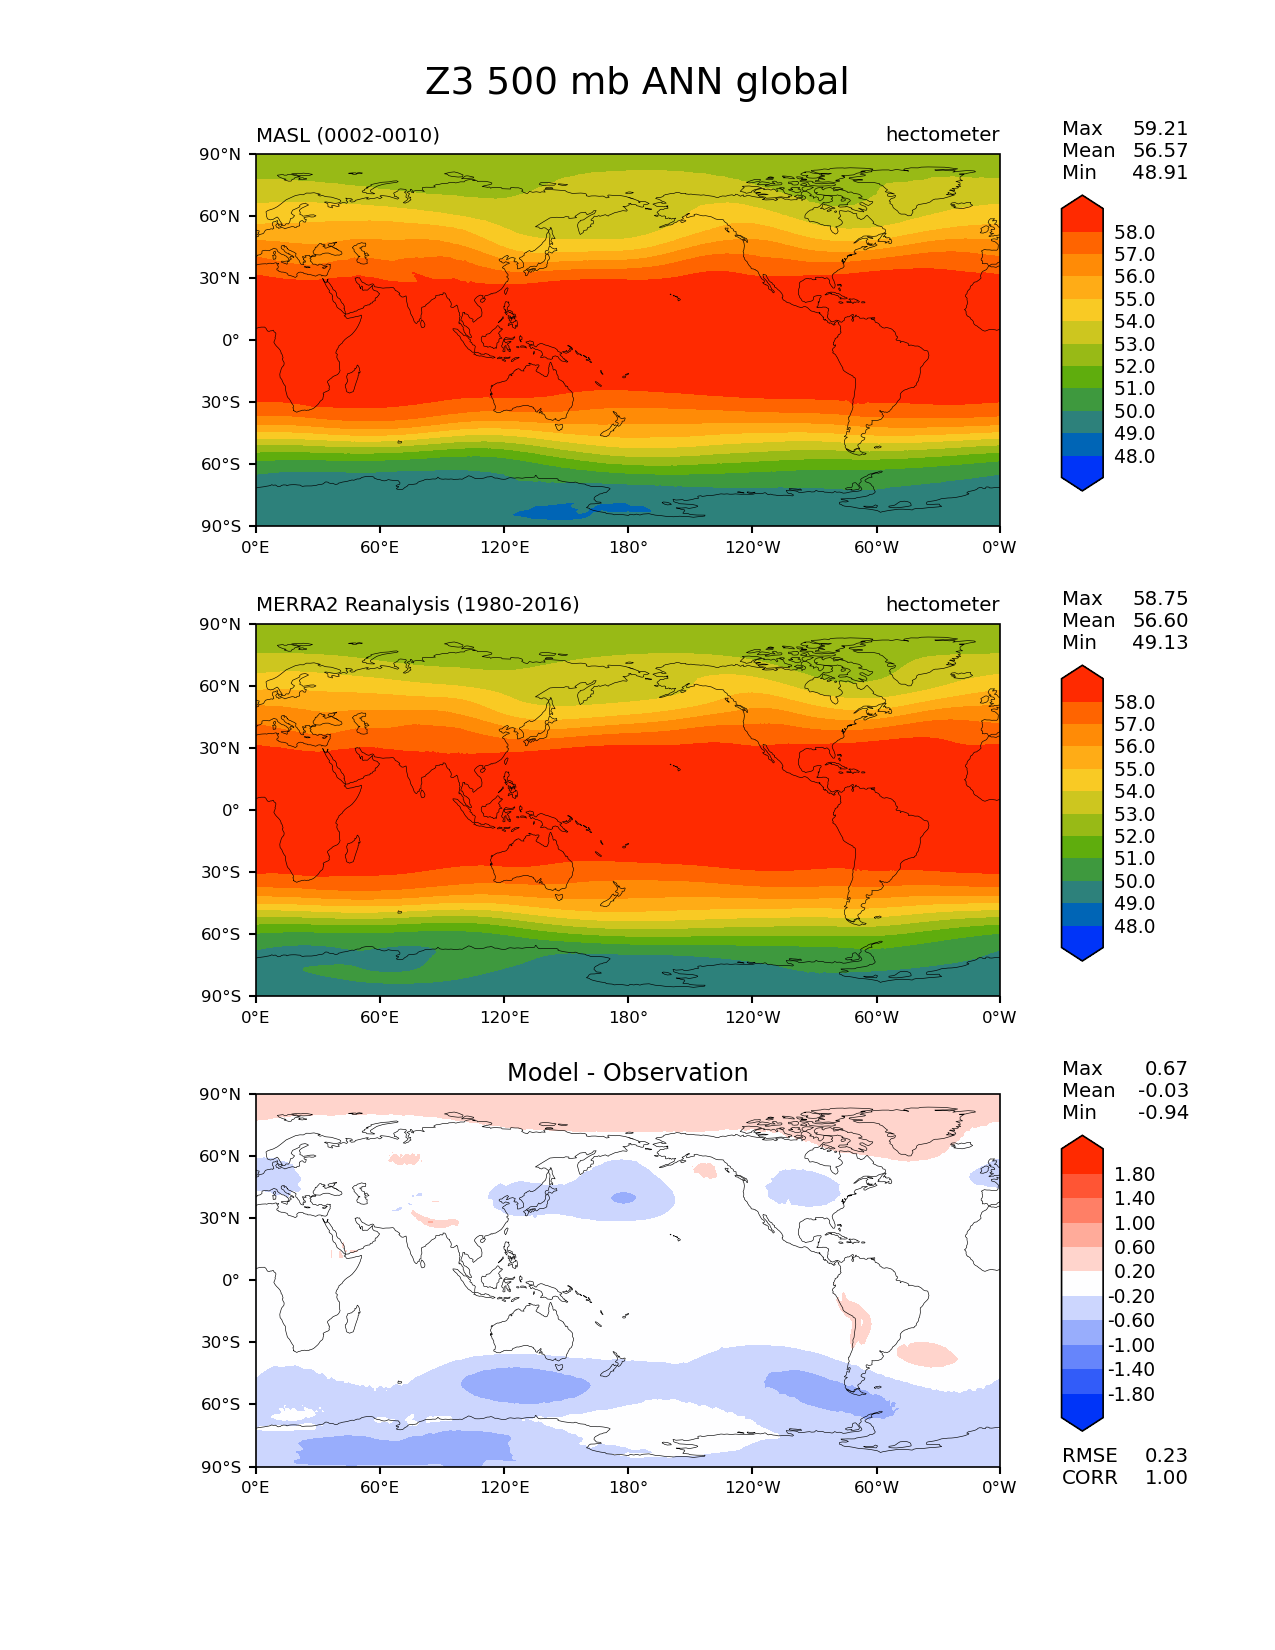
| Use this command to recreate this image: | e3sm_diags lat_lon --no_viewer --sets 'lat_lon' --case_id 'model_obs_9yr' --variables 'Z3' --ref_name 'MERRA2' --reference_name 'MERRA2 Reanalysis' --seasons 'ANN' --plevs '500.0' --contour_levels '48' '49' '50' '51' '52' '53' '54' '55' '56' '57' '58' --diff_levels '-1.8' '-1.4' '-1.0' '-0.6' '-0.2' '0.2' '0.6' '1.0' '1.4' '1.8' --run_type 'model_vs_obs' --regions 'global' --regrid_tool 'esmf' --regrid_method 'conservative' --main_title 'Z3 500 mb ANN global' --backend 'mpl' --output_format 'png' --canvas_size_w '1212' --canvas_size_h '1628' --figsize '8.5' '11.0' --dpi '150' --arrows --test_name 'E3SM_MMF_ne30pg2_overview' --short_test_name 'MASL' --test_colormap 'cet_rainbow.rgb' --reference_colormap 'cet_rainbow.rgb' --diff_title 'Model - Observation' --diff_colormap 'diverging_bwr.rgb' --multiprocessing --num_workers '32' --granulate 'variables' 'seasons' 'plevs' 'regions' --selectors 'sets' 'seasons' --reference_data_path '/global/project/projectdirs/e3sm/acme_diags/obs_for_e3sm_diags/climatology/' --results_dir '/global/project/projectdirs/e3sm/www/gxlin/model_obs' --test_data_path '/global/cscratch1/sd/gxlin/MMF_regrid_data/E3SM_MMF_ne30pg2_overview/climo_outdir_9yr/' |