Mean State

Download Data
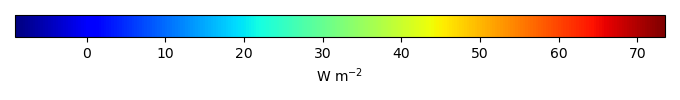
Period Mean (original grids) [W m-2]
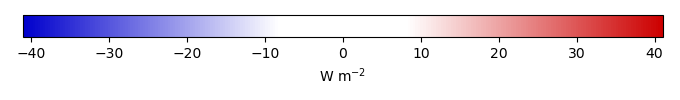
Bias [W m-2]
RMSE [W m-2]
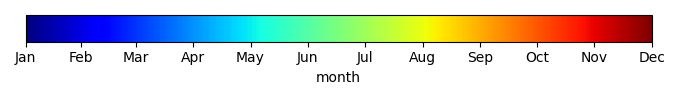
Phase Shift [months]
Bias Score [1]
RMSE Score [1]
Seasonal Cycle Score [1]
Overall Score [1]
Benchmark [-] 30.4
cmort_0.06 [-] 29.6 -0.630 27.5 1.25 0.646 0.408 0.849 0.578
cmort_0.18 [-] 29.6 -0.596 27.5 1.25 0.646 0.409 0.849 0.578
cmort_0.24 [-] 29.6 -0.613 27.5 1.25 0.645 0.408 0.849 0.578
cmort_0.30 [-] 29.6 -0.631 27.5 1.25 0.645 0.409 0.849 0.578
cmort_0.36 [-] 29.6 -0.635 27.5 1.25 0.645 0.408 0.849 0.578
cmort_0.42 [-] 29.6 -0.654 27.5 1.23 0.645 0.409 0.853 0.579
cmort_0.48 [-] 29.6 -0.667 27.5 1.23 0.645 0.409 0.853 0.579
cmort_0.54 [-] 29.5 -0.672 27.6 1.23 0.645 0.409 0.853 0.579
cmort_0.60 [-] 29.6 -0.670 27.6 1.23 0.645 0.408 0.853 0.578

Temporally integrated period mean

BENCHMARK MEAN
Data not available
Data not available
MODEL MEAN
Data not available
Data not available
BIAS
Data not available
Data not available
BIAS SCORE
Data not available
Data not available
RMSE
Data not available
Data not available
RMSE SCORE
Data not available
Data not available
BENCHMARK MAX MONTH
Data not available
Data not available
MODEL MAX MONTH
Data not available
Data not available
DIFFERENCE IN MAX MONTH
Data not available
Data not available
SEASONAL CYCLE SCORE
Data not available
Data not available

Spatially integrated regional mean

MODEL COLORS
Data not available
REGIONAL MEAN
Data not available
ANNUAL CYCLE
Data not available
MONTHLY ANOMALY
Data not available
ANNUAL CYCLE
Data not available

All Models

Benchmark
Data not available
Data not available
cmort_0.06
Data not available
Data not available
cmort_0.18
Data not available
Data not available
cmort_0.24
Data not available
Data not available
cmort_0.30
Data not available
Data not available
cmort_0.36
Data not available
Data not available
cmort_0.42
Data not available
Data not available
cmort_0.48
Data not available
Data not available
cmort_0.54
Data not available
Data not available
cmort_0.60
Data not available
Data not available

Data Information

  Title:
FluxNet Tower eddy covariance measurements (Tier 1)

  Version:
2015

  Institutions:
FluxNet, AmeriFlux, AfriFlux, AsiaFlux, ChinaFlux, Fluxnet-Canada, KoFlux, CarboAfrica, CarboEuropeIP, CarboItaly, CarboMont, GreenGrass, OzFlux-TERN, LBA, NECC, ICOS, TCOS-Siberia, and USCCC

  References:
Reichstein, M., D. Papale, R. Valentini, M. Aubinet, C. Bernhofer, A. Knohl, T. Laurila, A. Lindroth, E. Moors, K. Pilegaard, and G. Seufert (2007), Determinants of terrestrialecosystem carbon balance inferred from European eddy covarianceflux sites, Geophys. Res. Lett., 34, L01402, doi:10.1029/2006GL027880

Lasslop, G., M. Reichstein, D. Papale, A.D. Richardson, A. Arneth, A. Barr, P. Stoy, and G. Wohlfahrt (2010), Separation of net ecosystem exchange into assimilation and respiration using a light response curve approach: critical issues and global evaluation, Global Change Biology, 16, 187-208, doi:10.1111/j.1365-2486.2009.02041.x

Knauer, J., S. Zaehle, B.E. Medlyn, M. Reichstein, C.A. Williams, M. Migliavacca, M.G. De Kauwe, C. Werner, C. Keitel, P. Kolari, J.-M. Limousin, and M.-L. Linderson (2018), Towards physiologically meaningful water use efficiency estimates from eddy covariance data, Global Change Biology, 24(2), 694-710, doi:10.1111/gcb.13893

  Comment:
Fluxnet variable(s) used: H_F_MDS