Mean State

Download Data
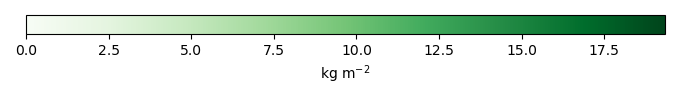
Period Mean (original grids) [Pg]
Model Period Mean (intersection) [Pg]
Benchmark Period Mean (intersection) [Pg]
Model Period Mean (complement) [Pg]
Benchmark Period Mean (complement) [Pg]
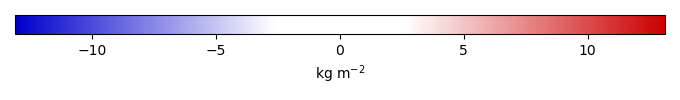
Bias [kg m-2]
Bias Score [1]
Spatial Distribution Score [1]
Overall Score [1]
Benchmark [-] 352.
v1 [-] 224. 175. 347. 49.2 4.77 -1.71 0.594 0.876 0.735
v2 [-] 228. 178. 347. 49.7 4.77 -1.64 0.599 0.875 0.737
v3-default [-] 236. 184. 347. 51.7 4.77 -1.54 0.601 0.873 0.737
v4 [-] 248. 194. 347. 53.9 4.77 -1.38 0.605 0.868 0.737
v5 [-] 264. 206. 347. 58.5 4.77 -1.16 0.606 0.856 0.731
v6 [-] 288. 227. 347. 61.6 4.77 -0.817 0.600 0.831 0.716
v7 [-] 318. 250. 347. 67.3 4.77 -0.408 0.579 0.790 0.684
v8 [-] 351. 277. 347. 73.4 4.77 0.0461 0.558 0.745 0.652

Temporally integrated period mean

BENCHMARK MEAN
Data not available
Data not available
MODEL MEAN
Data not available
Data not available
BIAS
Data not available
Data not available
BIAS SCORE
Data not available
Data not available

SPATIAL TAYLOR DIAGRAM
Data not available
MODEL COLORS
Data not available

Spatially integrated regional mean

MODEL COLORS
Data not available

All Models

Benchmark
Data not available
Data not available
v1
Data not available
Data not available
v2
Data not available
Data not available
v3-default
Data not available
Data not available
v4
Data not available
Data not available
v5
Data not available
Data not available
v6
Data not available
Data not available
v7
Data not available
Data not available
v8
Data not available
Data not available

Data Information

  Title:
Global Tropical Forest Biomass

  Institution:
NASA-JPL (NASA Jet Propulsion Laboratory, California Institute of Technology, Pasadena, California 91109, USA)

  Source:
4079 in situ inventory plots, satellite light detection and ranging (LiDAR) samples of forest structure, and optical and microwave imagery (1-km resolution) to extrapolate estimates

  History:
2015-01-08-T06:37:41Z Converted from 1 km x 1 km to 0.5 degree x 0.5 degree by Mingquan Mu (mmu@uci.edu) on Fri Jan 9 10:37:41 PST 2015

  References:
Saatchi, S. S., N. L. Harris, S. Brown, M. Lefsky, E. T. A. Mitchard, W. Salas, B. R. Zutta, W. Buermann, S. L. Lewis, S. Hagen, S. Petrova, L. White, M. Silman, and A. Morel (2011), Benchmark map of forest carbon stocks in tropical regions across three continents, Proc. Nat. Acad. Sci., 108(24):9899-9904, doi:10.1073/pnas.1019576108.

  Conventions:
CF-1.6

  Institute_id:
NASA-JPL

  Creation_date:
2015-01-08-T06:37:41Z

  Product:
observations

  Data_structure:
grid

  Realm:
land

  Contact:
Prof. James T. Randerson (jranders@uci.edu) or Dr. Mingquan Mu (mmu@uci.edu)