Mean State

Download Data
Period Mean (original grids) [1]
Model Period Mean (intersection) [1]
Benchmark Period Mean (intersection) [1]
Model Period Mean (complement) [1]
Benchmark Period Mean (complement) [1]
Bias [1]
RMSE [1]
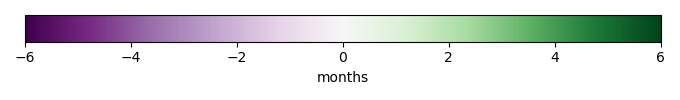
Phase Shift [months]
Bias Score [1]
RMSE Score [1]
Seasonal Cycle Score [1]
Spatial Distribution Score [1]
Overall Score [1]
Benchmark [-] 1.24
v1 [-] 0.827 0.824 1.23 0.847 1.46 -0.380 0.713 2.29 0.299 0.553 0.622 0.849 0.575
v2 [-] 0.841 0.838 1.23 0.865 1.46 -0.364 0.704 2.28 0.304 0.552 0.622 0.862 0.578
v3-default [-] 0.862 0.859 1.23 0.890 1.46 -0.343 0.695 2.29 0.309 0.551 0.621 0.879 0.582
v4 [-] 0.897 0.894 1.23 0.922 1.46 -0.306 0.683 2.28 0.319 0.549 0.628 0.902 0.589
v5 [-] 0.948 0.944 1.23 0.981 1.46 -0.253 0.666 2.28 0.337 0.544 0.624 0.928 0.595
v6 [-] 1.02 1.02 1.23 1.07 1.46 -0.172 0.651 2.25 0.384 0.539 0.633 0.945 0.608
v7 [-] 1.13 1.12 1.23 1.18 1.46 -0.0660 0.677 2.25 0.347 0.535 0.638 0.930 0.597
v8 [-] 1.22 1.22 1.23 1.28 1.46 0.0362 0.731 2.23 0.323 0.526 0.638 0.891 0.581

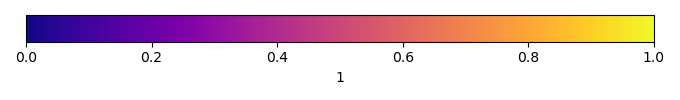
Temporally integrated period mean

BENCHMARK MEAN
Data not available
Data not available
MODEL MEAN
Data not available
Data not available
BIAS
Data not available
Data not available
BIAS SCORE
Data not available
Data not available
RMSE
Data not available
Data not available
RMSE SCORE
Data not available
Data not available
BENCHMARK MAX MONTH
Data not available
Data not available
MODEL MAX MONTH
Data not available
Data not available
DIFFERENCE IN MAX MONTH
Data not available
Data not available
SEASONAL CYCLE SCORE
Data not available
Data not available

SPATIAL TAYLOR DIAGRAM
Data not available
MODEL COLORS
Data not available

Spatially integrated regional mean

MODEL COLORS
Data not available
REGIONAL MEAN
Data not available
ANNUAL CYCLE
Data not available
MONTHLY ANOMALY
Data not available
ANNUAL CYCLE
Data not available

All Models

Benchmark
Data not available
Data not available
v1
Data not available
Data not available
v2
Data not available
Data not available
v3-default
Data not available
Data not available
v4
Data not available
Data not available
v5
Data not available
Data not available
v6
Data not available
Data not available
v7
Data not available
Data not available
v8
Data not available
Data not available

Data Information

  Title:
NOAA Climate Data Record (CDR) of AVHRR Leaf Area Index (LAI) and Fraction of Absorbed Photosynthetically Active Radiation (FAPAR), AVH15C1

  Version:
5

  Institutions:
Goddard Space Flight Center (GSFC), NASA, USA
University of Maryland (UMD), USA
Climate Data Record (CDR), NOAA, USA
National Centers for Environmental Information (NCEI), NESDIS, NOAA, U.S. Department of Commerce

  Source:
This daily gridded Leaf Area Index (LAI) derived from the NOAA Climate Data Record (CDR) of Advanced Very High Resolution Radiometer (AVHRR) Surface Reflectance.

  History:
2019-08-23: downloaded source from https://www.ncei.noaa.gov/metadata/geoportal/rest/metadata/item/gov.noaa.ncdc:C01559/html
2019-09-12: converted to netCDF with https://github.com/mmu2019/Datasets/blob/master/read-lai-avh15c1.py

  References:
Vermote, Eric (2019), NOAA Climate Data Record (CDR) of AVHRR Leaf Area Index (LAI) and Fraction of Absorbed Photosynthetically Active Radiation (FAPAR) Version 5, NOAA National Centers for Environmental Information, , , doi:10.7289/V5TT4P69

Claverie, M., Matthews, J., Vermote, E., and Justice, C. (2016), A 30+ Year AVHRR LAI and FAPAR Climate Data Record: Algorithm Description and Validation, Remote Sensing, 8, 263, doi:10.3390/rs8030263

  Comments:
time_period: 1981-01 through 2019-12
original_temporal_resolution: daily
original_spatial_resolution: 0.05 degree
original_units: 1
final_temporal_resolution: monthly
final_spatial_resolution: 0.5 degree
final_units: 1

  Convention:
CF-1.7