Mean State

Download Data
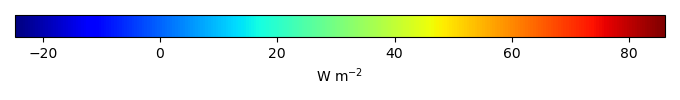
Period Mean (original grids) [W m-2]
Model Period Mean (intersection) [W m-2]
Benchmark Period Mean (intersection) [W m-2]
Model Period Mean (complement) [W m-2]
Benchmark Period Mean (complement) [W m-2]
Bias [W m-2]
RMSE [W m-2]
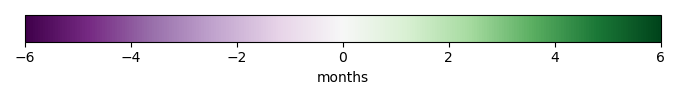
Phase Shift [months]
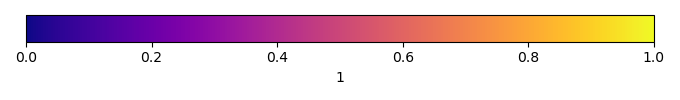
Bias Score [1]
RMSE Score [1]
Seasonal Cycle Score [1]
Spatial Distribution Score [1]
Overall Score [1]
Benchmark [-] 39.1
v1 [-] 28.1 32.6 39.1 12.2 43.0 -5.67 14.0 0.947 0.612 0.615 0.896 0.926 0.733
v2 [-] 28.1 32.6 39.1 12.2 43.0 -5.67 14.0 0.943 0.611 0.615 0.896 0.927 0.733
v3-default [-] 28.1 32.6 39.1 12.2 43.0 -5.67 14.0 0.941 0.612 0.615 0.897 0.927 0.733
v4 [-] 28.1 32.7 39.1 12.2 43.0 -5.66 14.0 0.938 0.611 0.615 0.897 0.927 0.733
v5 [-] 28.2 32.7 39.1 12.2 43.0 -5.65 13.9 0.945 0.612 0.615 0.896 0.927 0.733
v6 [-] 28.1 32.6 39.1 12.2 43.0 -5.71 14.0 0.938 0.610 0.615 0.896 0.927 0.733
v7 [-] 28.0 32.5 39.1 12.2 43.0 -5.78 14.1 0.931 0.607 0.615 0.898 0.927 0.732
v8 [-] 27.9 32.4 39.1 12.1 43.0 -5.92 14.2 0.937 0.605 0.614 0.896 0.925 0.731

Temporally integrated period mean

BENCHMARK MEAN
Data not available
Data not available
MODEL MEAN
Data not available
Data not available
BIAS
Data not available
Data not available
BIAS SCORE
Data not available
Data not available
RMSE
Data not available
Data not available
RMSE SCORE
Data not available
Data not available
BENCHMARK MAX MONTH
Data not available
Data not available
MODEL MAX MONTH
Data not available
Data not available
DIFFERENCE IN MAX MONTH
Data not available
Data not available
SEASONAL CYCLE SCORE
Data not available
Data not available

SPATIAL TAYLOR DIAGRAM
Data not available
MODEL COLORS
Data not available

Spatially integrated regional mean

MODEL COLORS
Data not available
REGIONAL MEAN
Data not available
ANNUAL CYCLE
Data not available
MONTHLY ANOMALY
Data not available
ANNUAL CYCLE
Data not available

All Models

Benchmark
Data not available
Data not available
v1
Data not available
Data not available
v2
Data not available
Data not available
v3-default
Data not available
Data not available
v4
Data not available
Data not available
v5
Data not available
Data not available
v6
Data not available
Data not available
v7
Data not available
Data not available
v8
Data not available
Data not available

Data Information

  Title:
Water, Energy, and Carbon with Artificial Neural Networks (WECANN)

  Version:
1

  Institutions:
Columbia University

  Source:
Solar Induced Fluorescence (SIF), Air Temperature, Precipitation, Net Radiation, Soil Moisture, and Snow Water Equivalent

  History:
2020-11-02: downloaded https://avdc.gsfc.nasa.gov/pub/data/project/WECANN/WECANN_v1.0.nc
2020-11-02: converted to ILAMB-ready netCDF

  References:
Alemohammad, S. H. and Fang, B. and Konings, A. G. and Aires, F. and Green, J. K. and Kolassa, J. and Miralles, D. and Prigent, C. and Gentine, P. (2017), Biogeosciences, 18, 4101--4124, doi:10.5194/bg-14-4101-2017

  Comments:
time_period: 2007-01 through 2015-11
temporal_resolution: monthly
spatial_resolution: 1.0 degree
units: W/m^2

  Convention:
CF-1.8