Mean State
Download Data |
Period Mean (original grids) [Pg] |
Model Period Mean (intersection) [Pg] |
Benchmark Period Mean (intersection) [Pg] |
Model Period Mean (complement) [Pg] |
Benchmark Period Mean (complement) [Pg] |
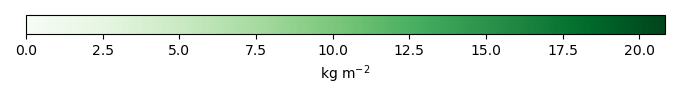
Bias [kg m-2] |
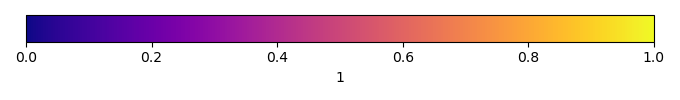
Bias Score [1] |
Spatial Distribution Score [1] |
Overall Score [1] |
|||
|---|---|---|---|---|---|---|---|---|---|---|---|---|
| Benchmark | [-] | 25.1 | ||||||||||
| v1-shallowest | [-] | 310. | 6.83 | 25.0 | 303. | 0.115 | -1.81 | 0.448 | 0.321 | 0.385 | ||
| v2 | [-] | 319. | 6.97 | 25.0 | 312. | 0.115 | -1.79 | 0.449 | 0.340 | 0.394 | ||
| v3-default | [-] | 328. | 7.32 | 25.0 | 320. | 0.115 | -1.75 | 0.450 | 0.363 | 0.407 | ||
| v4 | [-] | 341. | 7.70 | 25.0 | 334. | 0.115 | -1.70 | 0.453 | 0.391 | 0.422 | ||
| v5 | [-] | 360. | 8.10 | 25.0 | 352. | 0.115 | -1.64 | 0.453 | 0.426 | 0.440 | ||
| v6-measured | [-] | 387. | 8.74 | 25.0 | 378. | 0.115 | -1.56 | 0.454 | 0.464 | 0.459 | ||
| v7 | [-] | 420. | 9.21 | 25.0 | 410. | 0.115 | -1.49 | 0.454 | 0.512 | 0.483 | ||
| v8-steepest | [-] | 454. | 10.0 | 25.0 | 444. | 0.115 | -1.38 | 0.454 | 0.558 | 0.506 |
Temporally integrated period mean