Mean State
Download Data |
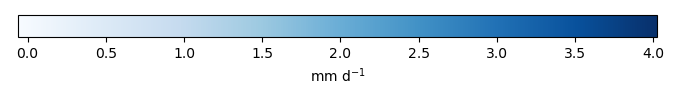
Period Mean (original grids) [mm d-1] |
Model Period Mean (intersection) [mm d-1] |
Benchmark Period Mean (intersection) [mm d-1] |
Model Period Mean (complement) [mm d-1] |
Benchmark Period Mean (complement) [mm d-1] |
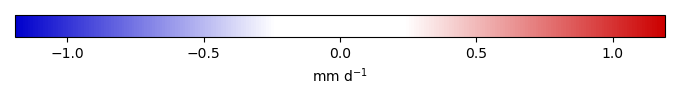
Bias [mm d-1] |
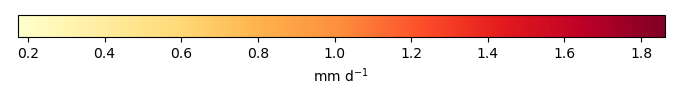
RMSE [mm d-1] |
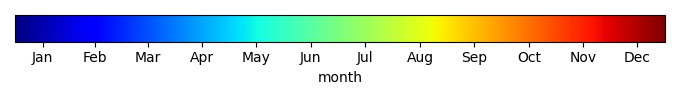
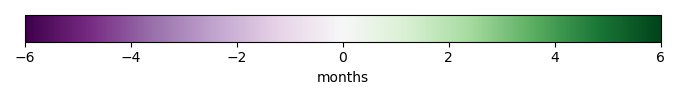
Phase Shift [months] |
Bias Score [1] |
RMSE Score [1] |
Seasonal Cycle Score [1] |
Spatial Distribution Score [1] |
Overall Score [1] |
|||
|---|---|---|---|---|---|---|---|---|---|---|---|---|---|---|---|---|
| Benchmark | [-] | 1.56 | ||||||||||||||
| v1-shallowest | [-] | 1.29 | 1.58 | 1.56 | 0.680 | 2.23 | 0.0635 | 0.674 | 1.40 | 0.561 | 0.524 | 0.772 | 0.971 | 0.671 | ||
| v2 | [-] | 1.29 | 1.58 | 1.56 | 0.679 | 2.23 | 0.0643 | 0.672 | 1.39 | 0.562 | 0.525 | 0.773 | 0.972 | 0.671 | ||
| v3-default | [-] | 1.29 | 1.58 | 1.56 | 0.680 | 2.23 | 0.0655 | 0.671 | 1.40 | 0.564 | 0.526 | 0.773 | 0.972 | 0.672 | ||
| v4 | [-] | 1.29 | 1.59 | 1.56 | 0.680 | 2.23 | 0.0670 | 0.670 | 1.39 | 0.566 | 0.526 | 0.772 | 0.972 | 0.673 | ||
| v5 | [-] | 1.29 | 1.59 | 1.56 | 0.680 | 2.23 | 0.0696 | 0.668 | 1.40 | 0.569 | 0.527 | 0.771 | 0.973 | 0.673 | ||
| v6-measured | [-] | 1.30 | 1.59 | 1.56 | 0.681 | 2.23 | 0.0751 | 0.665 | 1.39 | 0.576 | 0.527 | 0.770 | 0.974 | 0.675 | ||
| v7 | [-] | 1.30 | 1.60 | 1.56 | 0.683 | 2.23 | 0.0839 | 0.662 | 1.37 | 0.585 | 0.527 | 0.778 | 0.975 | 0.678 | ||
| v8-steepest | [-] | 1.31 | 1.61 | 1.56 | 0.685 | 2.23 | 0.0924 | 0.660 | 1.37 | 0.592 | 0.526 | 0.777 | 0.975 | 0.679 |
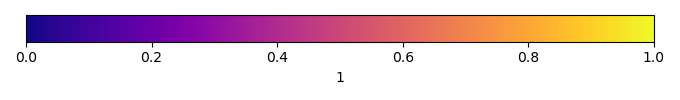
Temporally integrated period mean