Mean State
Download Data |
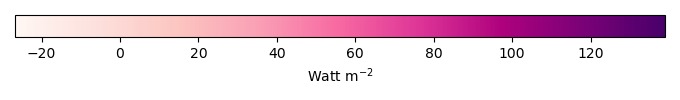
Period Mean (original grids) [Watt m-2] |
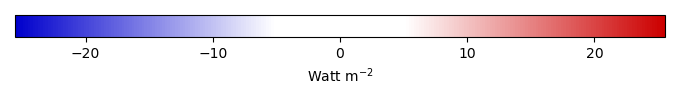
Bias [Watt m-2] |
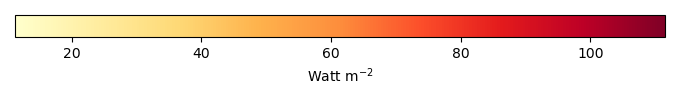
RMSE [Watt m-2] |
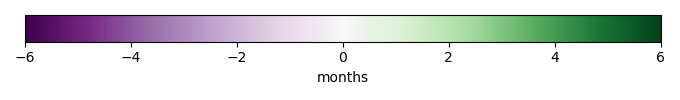
Phase Shift [months] |
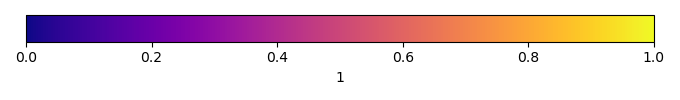
Bias Score [1] |
RMSE Score [1] |
Seasonal Cycle Score [1] |
Overall Score [1] |
|||
|---|---|---|---|---|---|---|---|---|---|---|---|
| Benchmark | [-] | 38.3 | |||||||||
| v1-shallowest | [-] | 65.0 | 20.5 | 46.5 | 0.816 | 0.843 | 0.702 | 0.906 | 0.788 | ||
| v2 | [-] | 65.0 | 20.5 | 46.5 | 0.816 | 0.843 | 0.703 | 0.906 | 0.788 | ||
| v3-default | [-] | 65.0 | 20.5 | 46.5 | 0.816 | 0.842 | 0.703 | 0.906 | 0.788 | ||
| v4 | [-] | 65.0 | 20.5 | 46.5 | 0.816 | 0.842 | 0.703 | 0.906 | 0.788 | ||
| v5 | [-] | 65.0 | 20.5 | 46.5 | 0.816 | 0.840 | 0.704 | 0.906 | 0.788 | ||
| v6-measured | [-] | 65.0 | 20.6 | 46.5 | 0.883 | 0.840 | 0.704 | 0.901 | 0.787 | ||
| v7 | [-] | 65.1 | 20.6 | 46.5 | 0.816 | 0.840 | 0.703 | 0.906 | 0.788 | ||
| v8-steepest | [-] | 65.1 | 20.6 | 46.6 | 0.883 | 0.840 | 0.702 | 0.901 | 0.786 |
Temporally integrated period mean