Quick Links

Global Mixed-Layer Depth
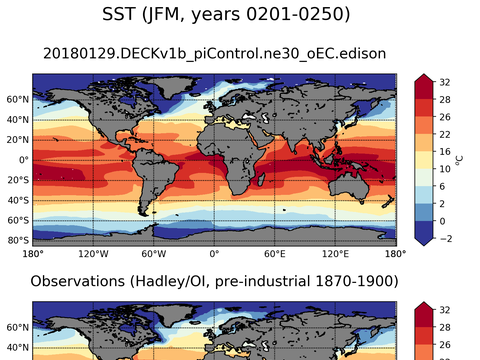
Global Sea Surface Temperature
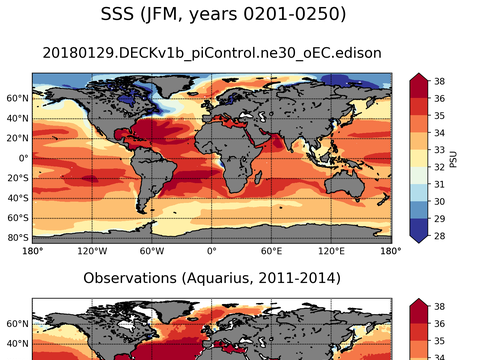
Global Sea Surface Salinity

Global Sea Surface Height
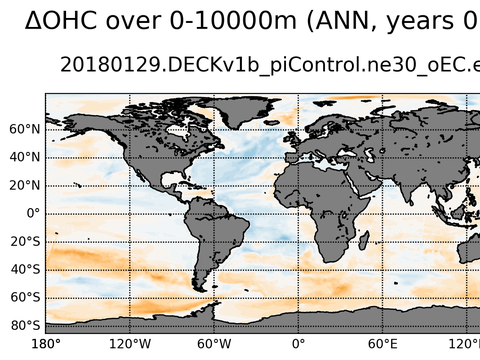
Global OHC Anomaly
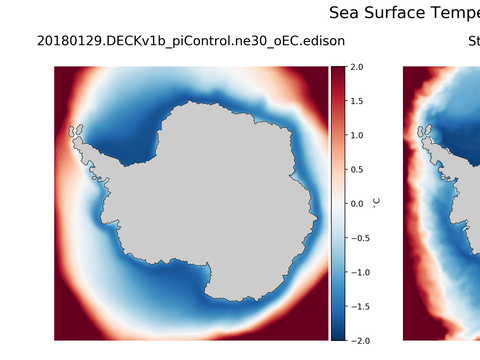
Antarctic Temperature
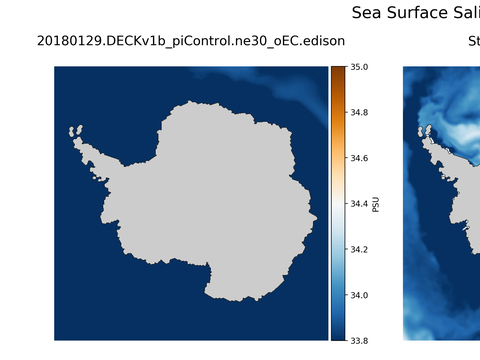
Antarctic Salinity
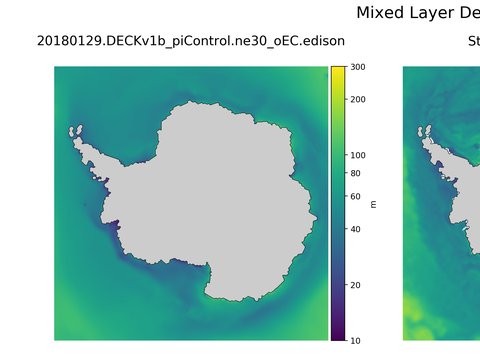
Antarctic Mixed Layer Depth

Global Argo Temperature
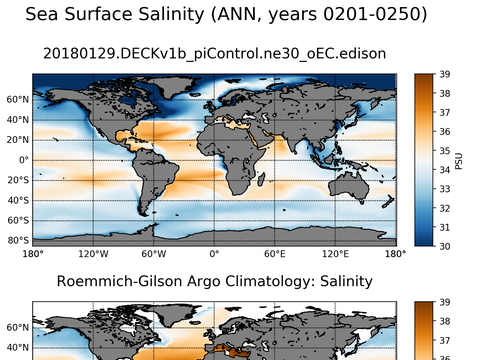
Global Argo Salinity

Trends vs Depth

Time Series

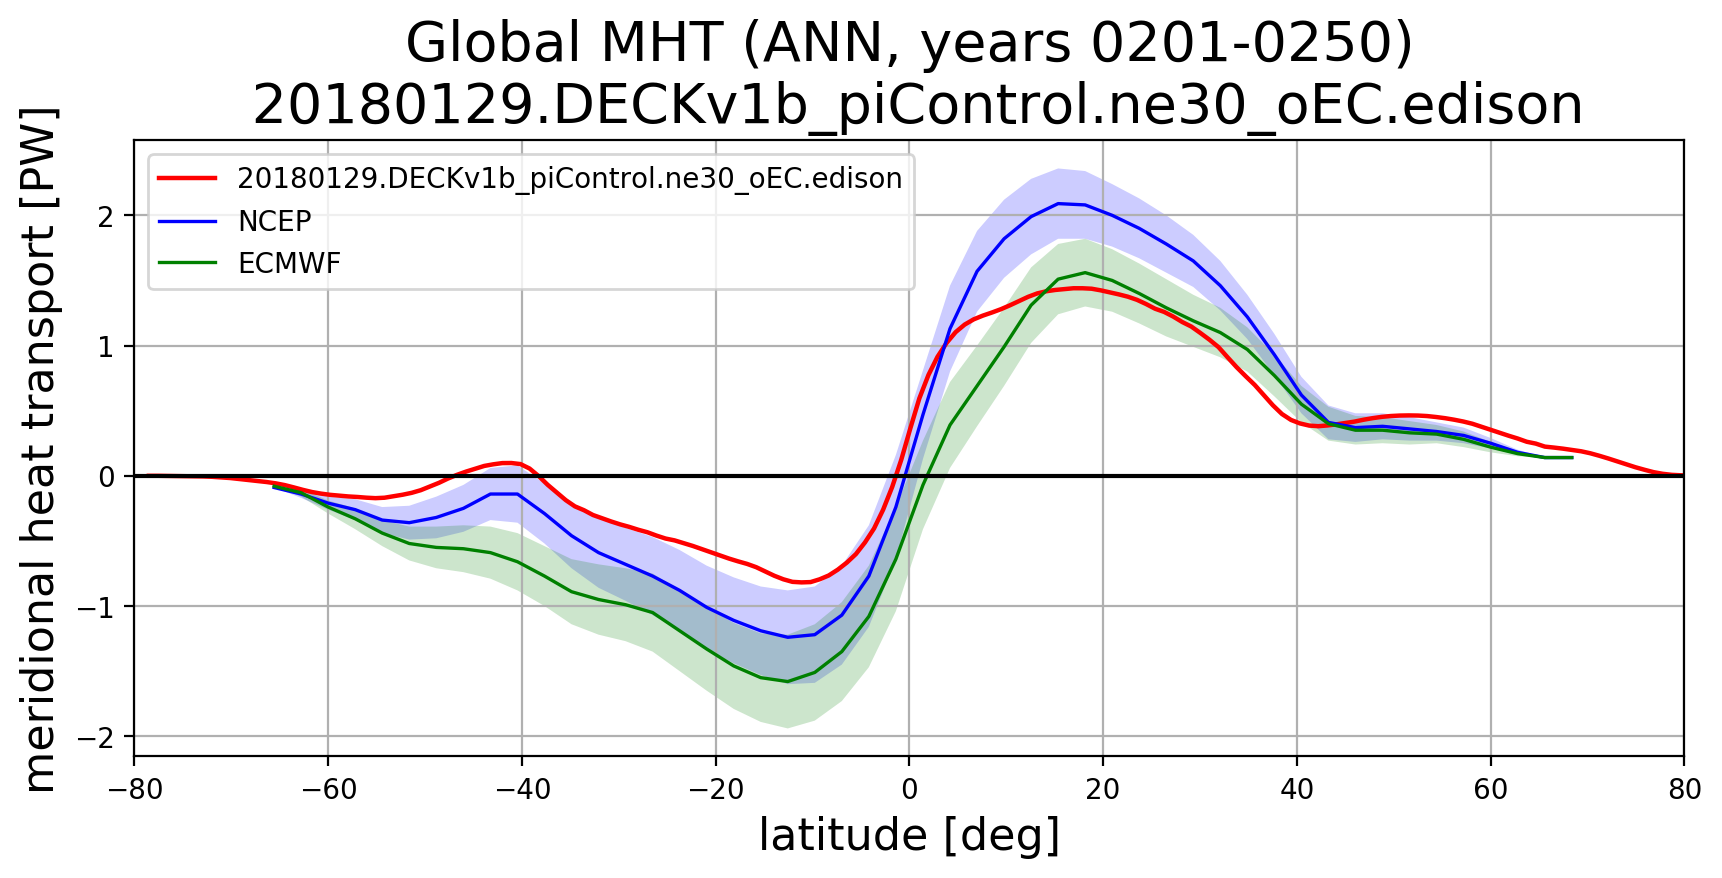
Meridional Heat Transport
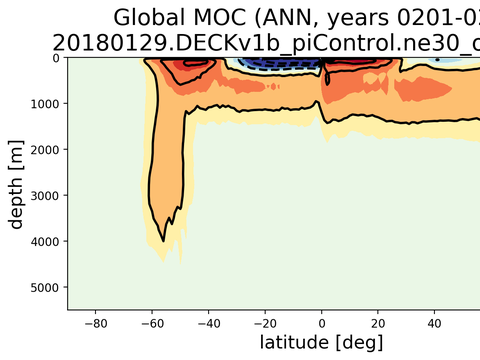
Meridional Overturning Streamfunction
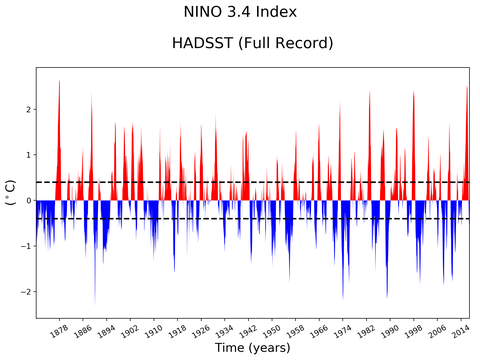
El Niño 3.4 Climate Index
Observations: Holte-Talley ARGO
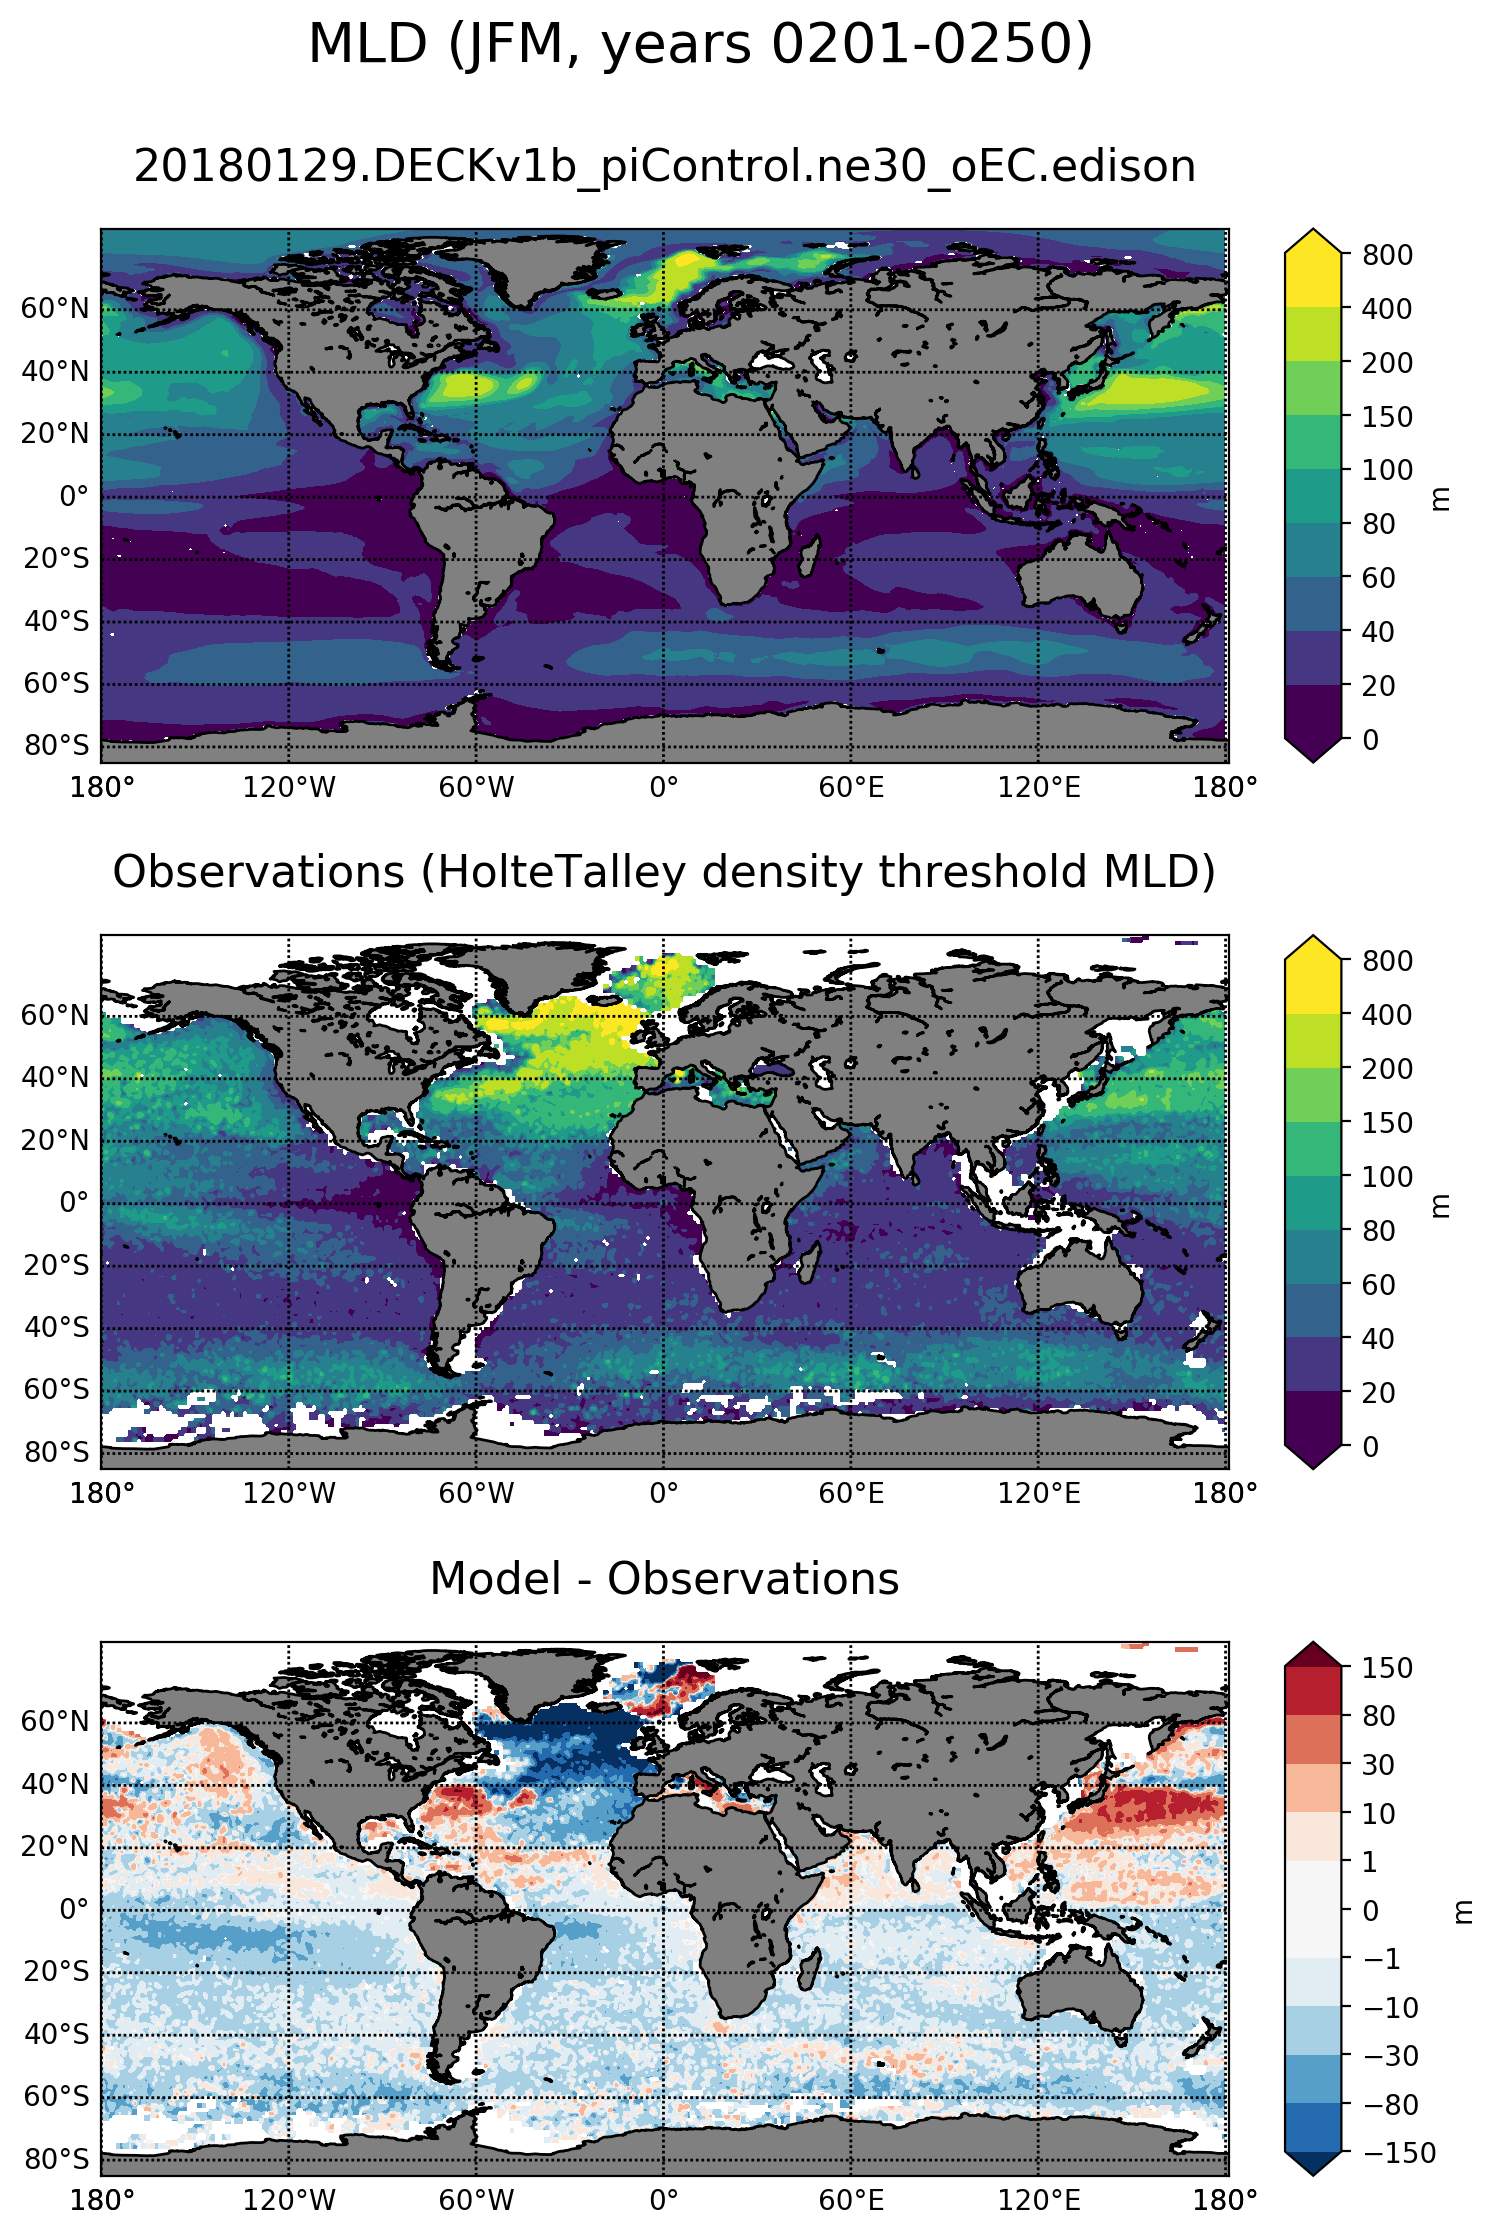
JFM
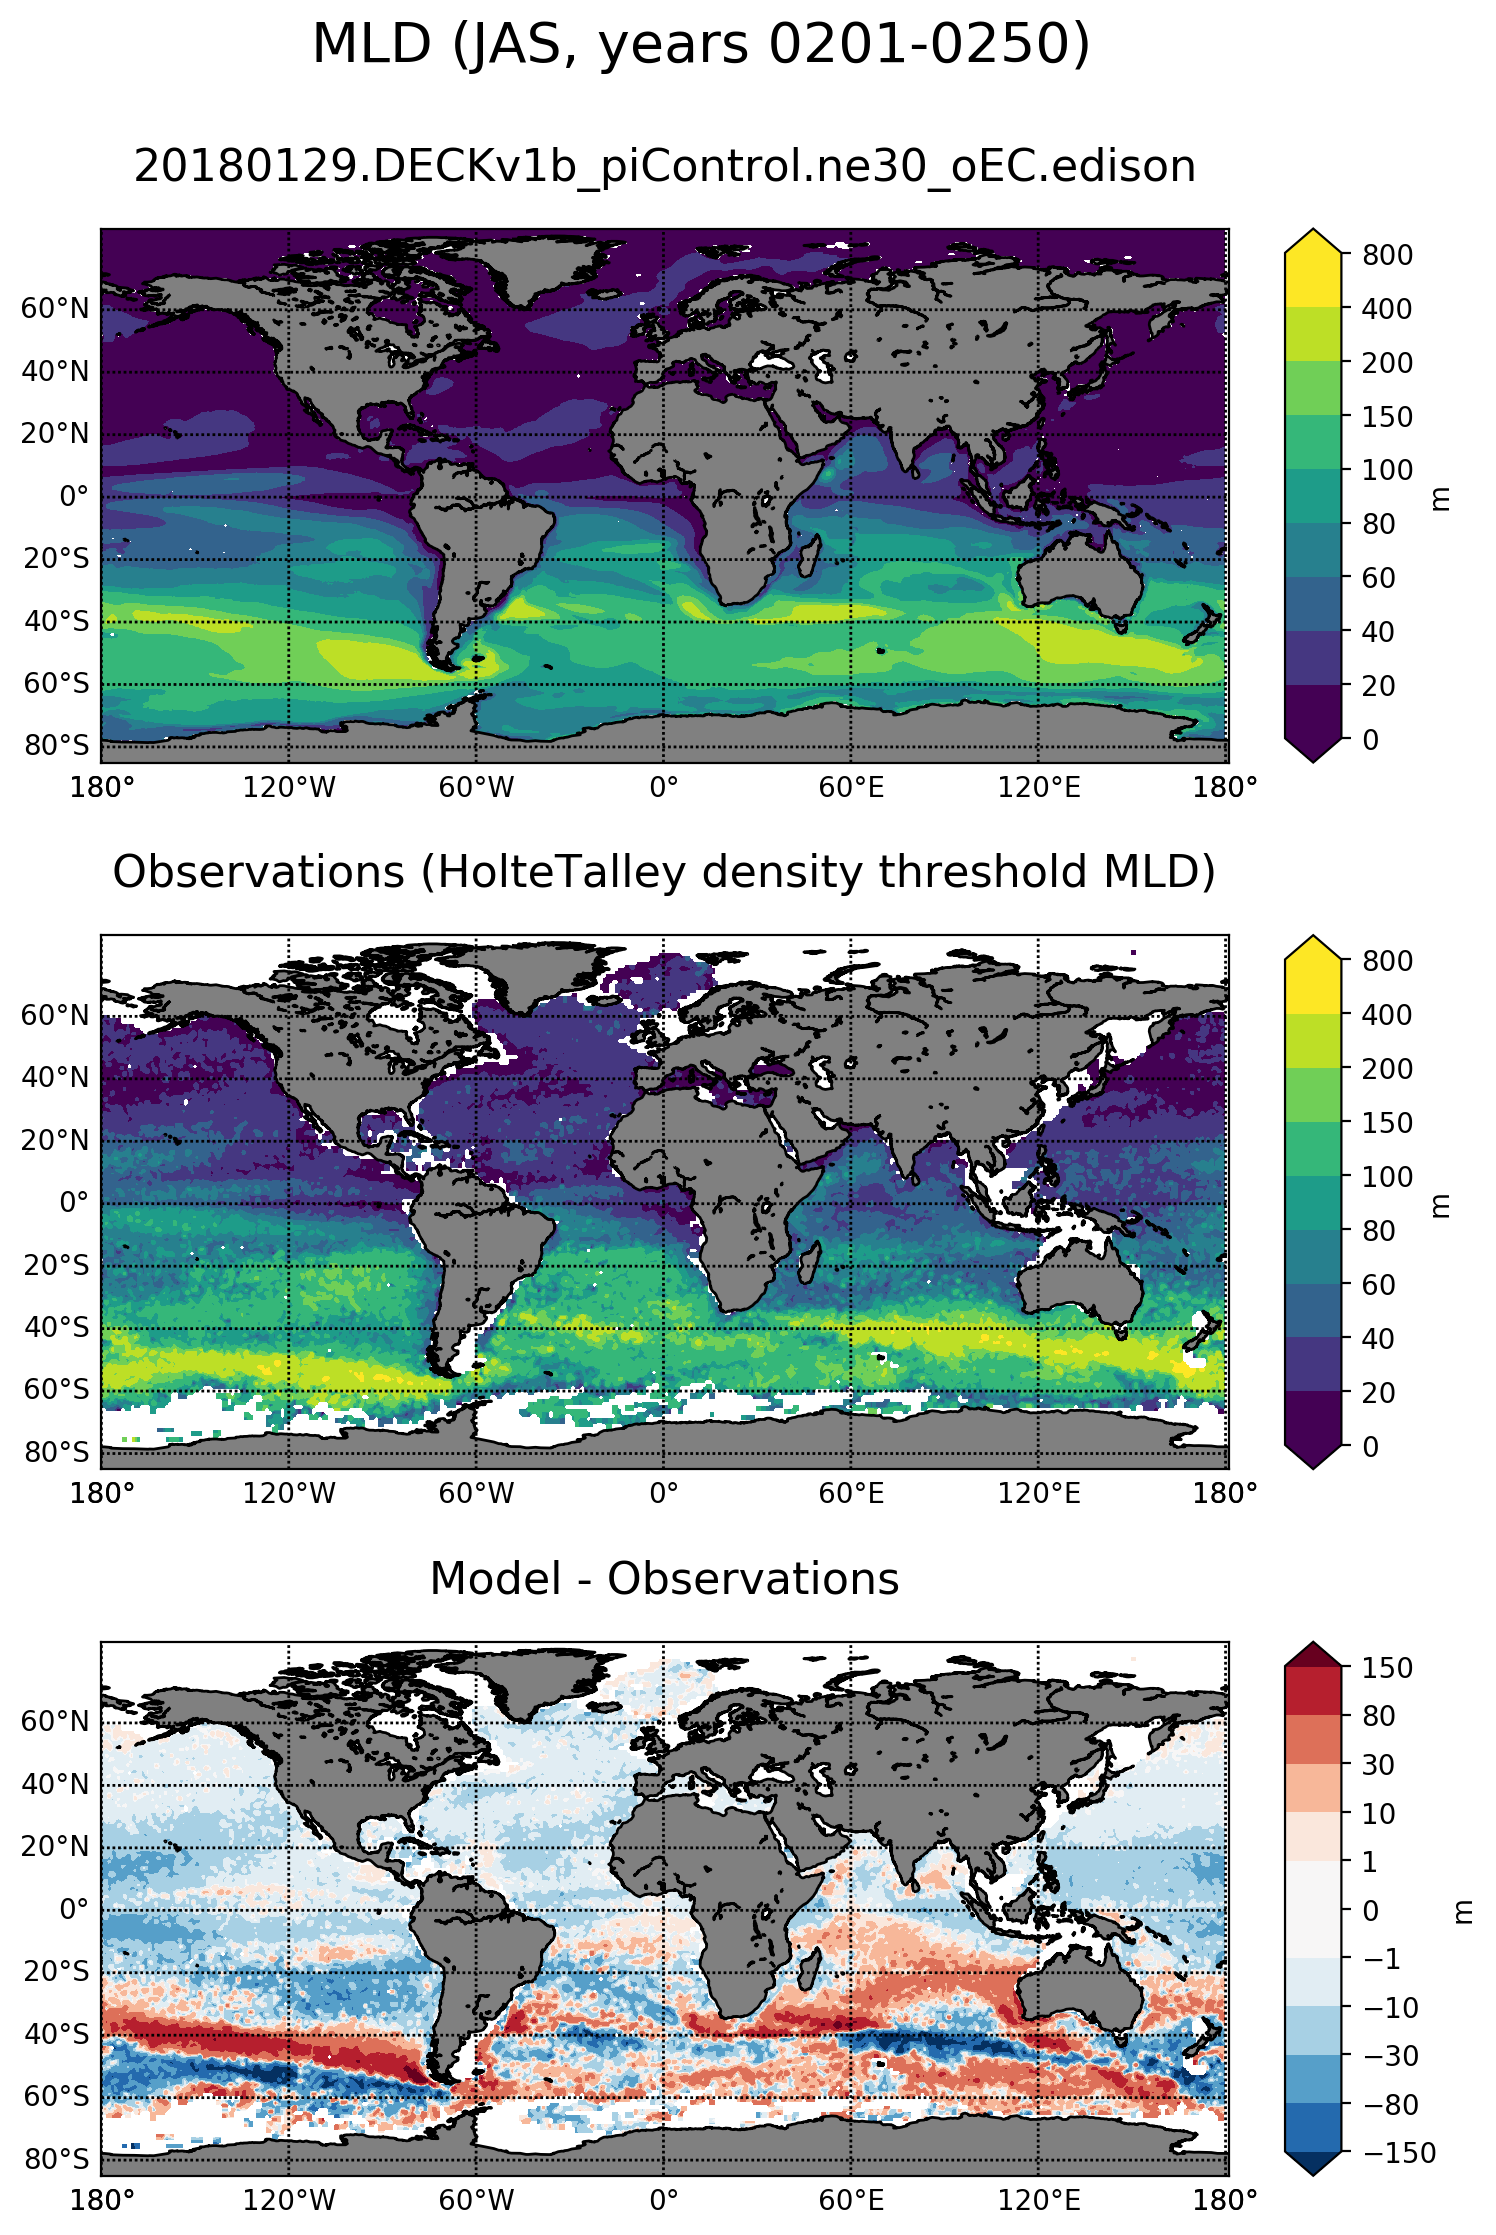
JAS
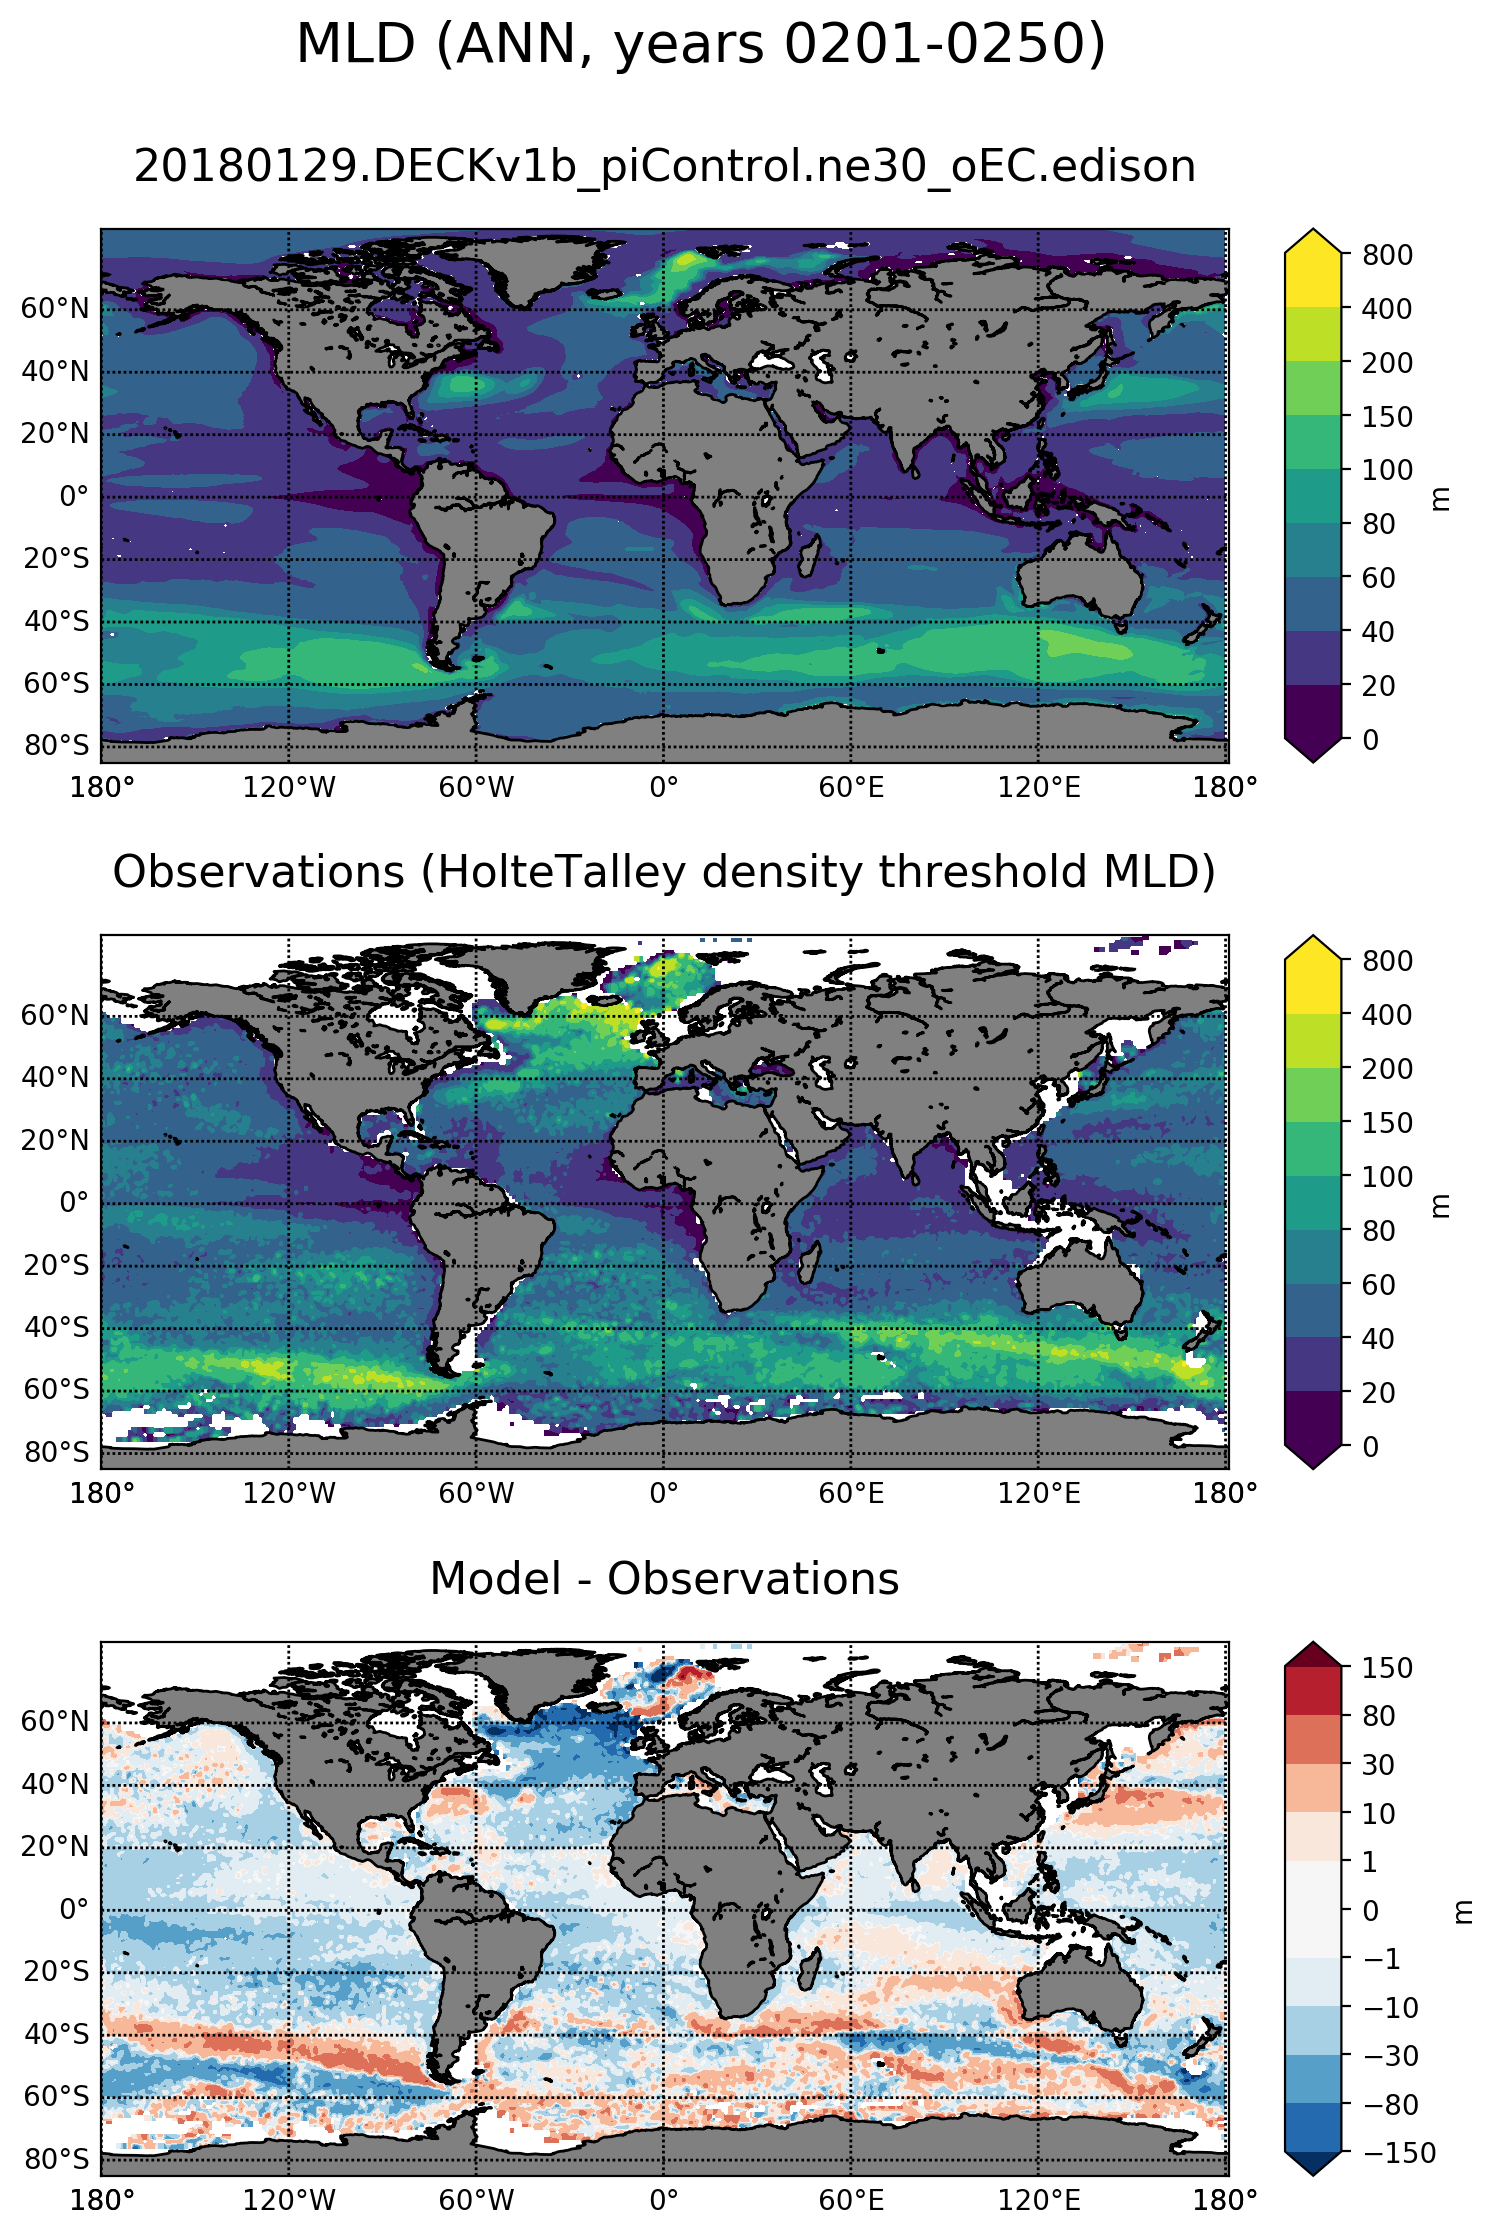
ANN
Observations: Hadley-NOAA-OI

JFM

JAS
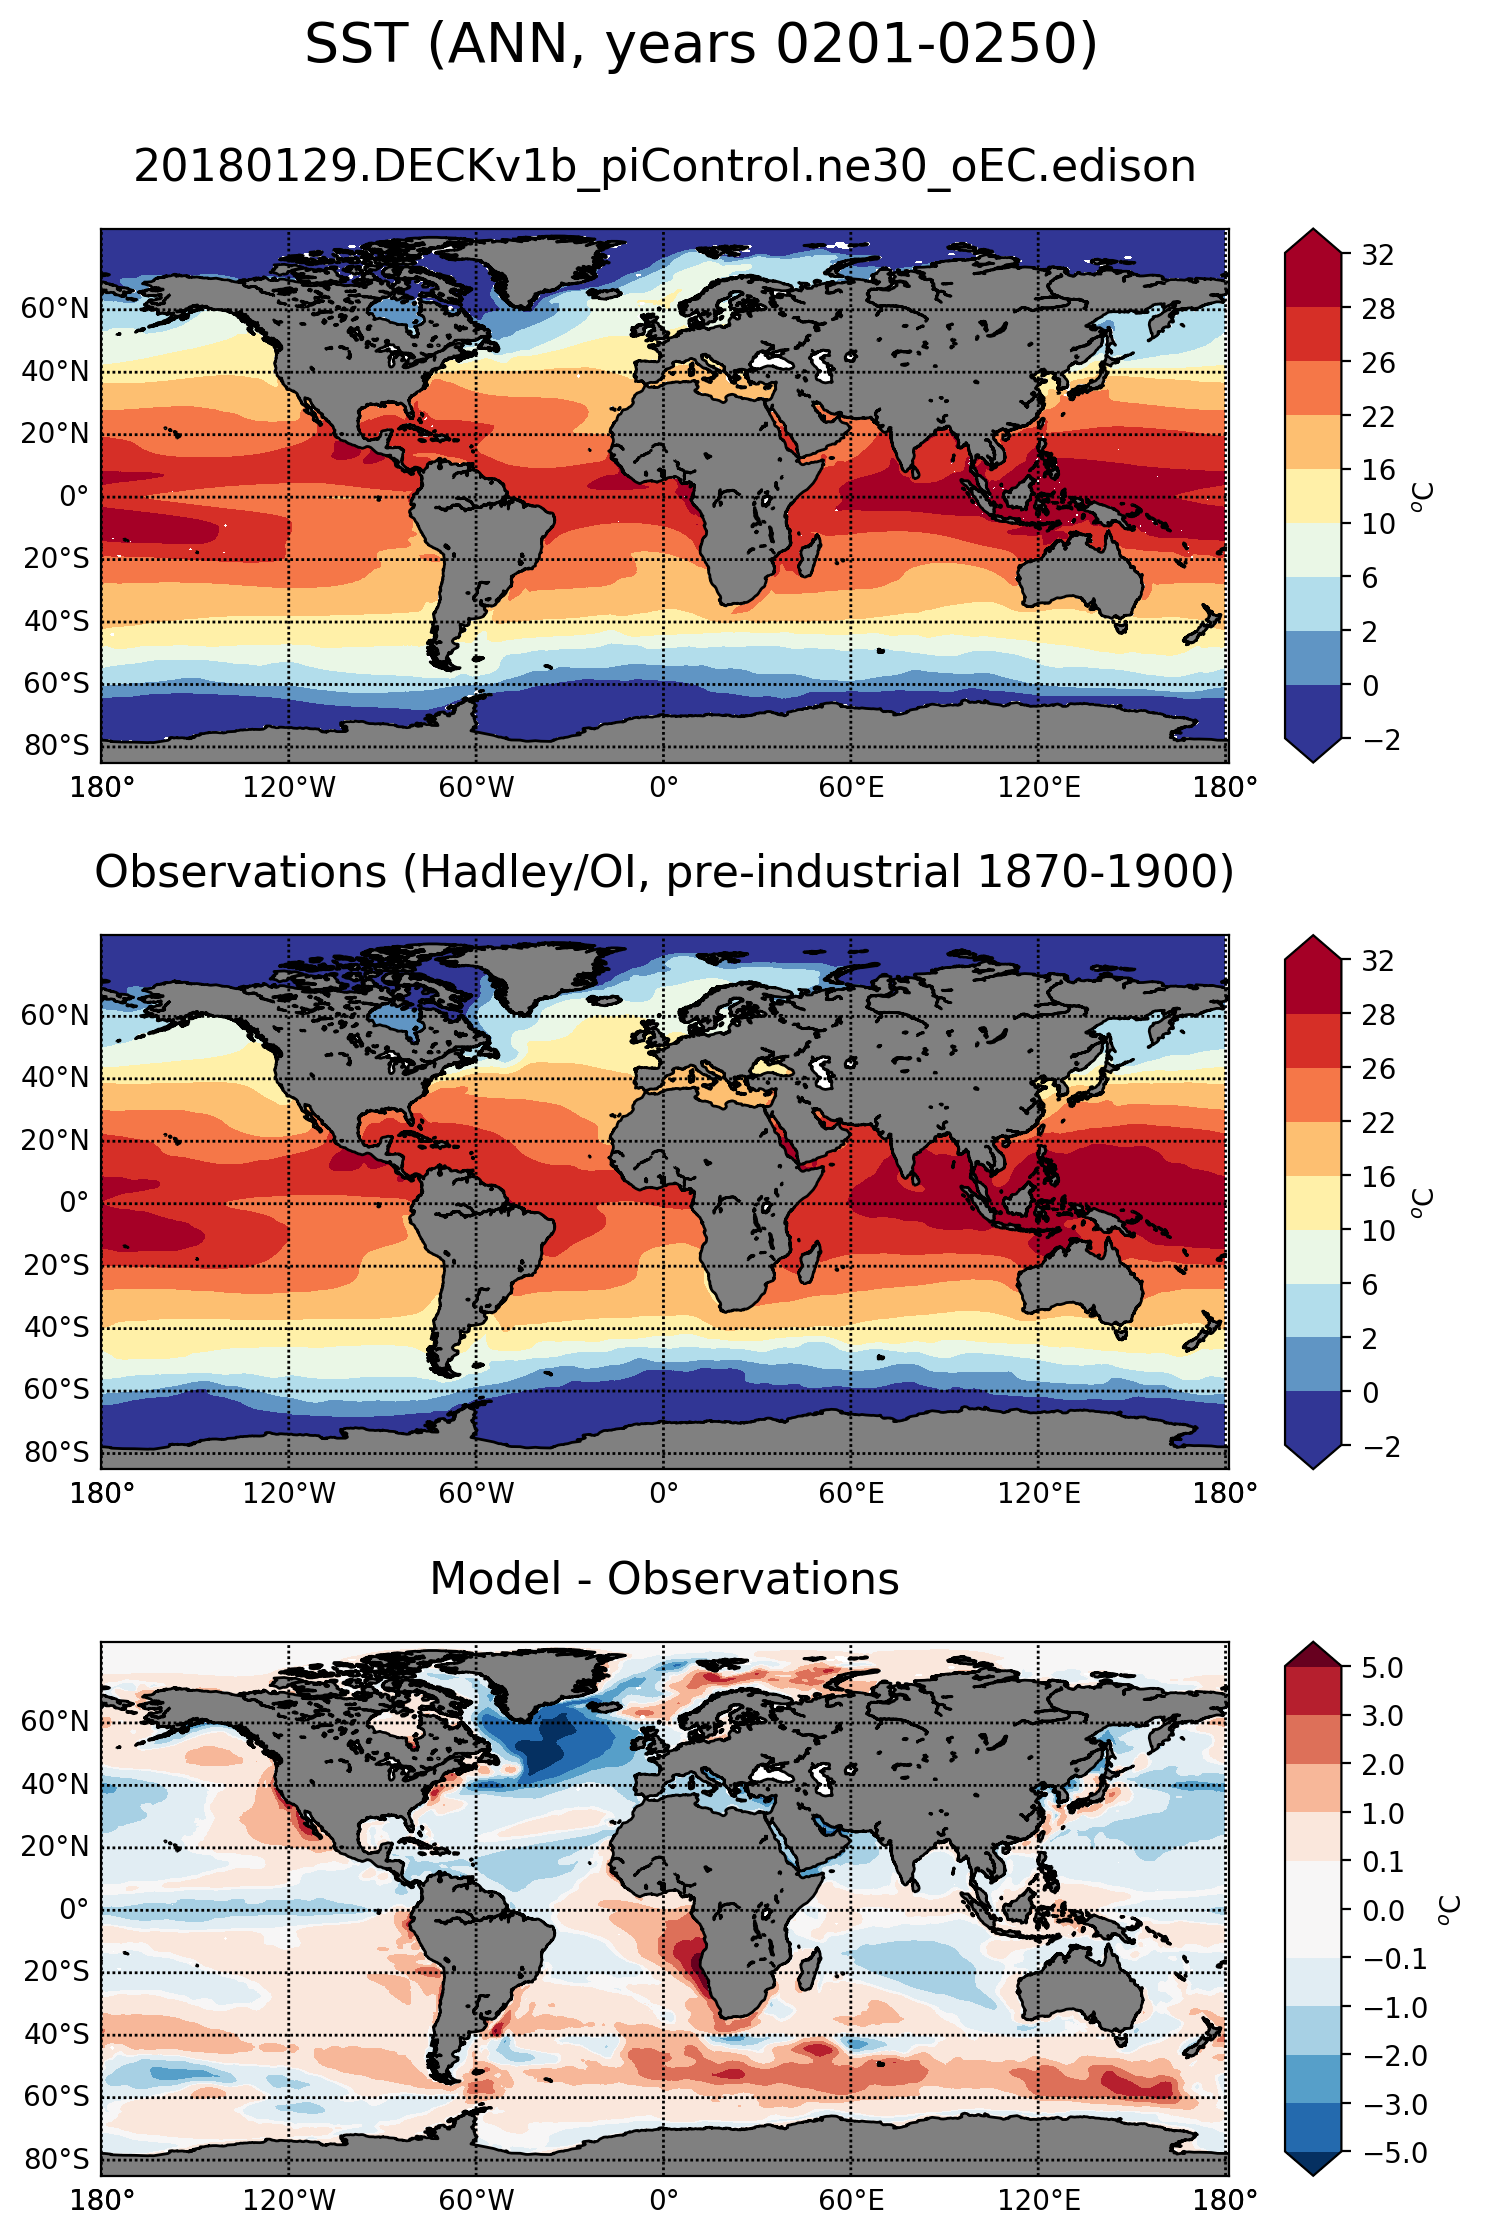
ANN
Observations: Aquarius

JFM

JAS

ANN
Observations: AVISO

JFM
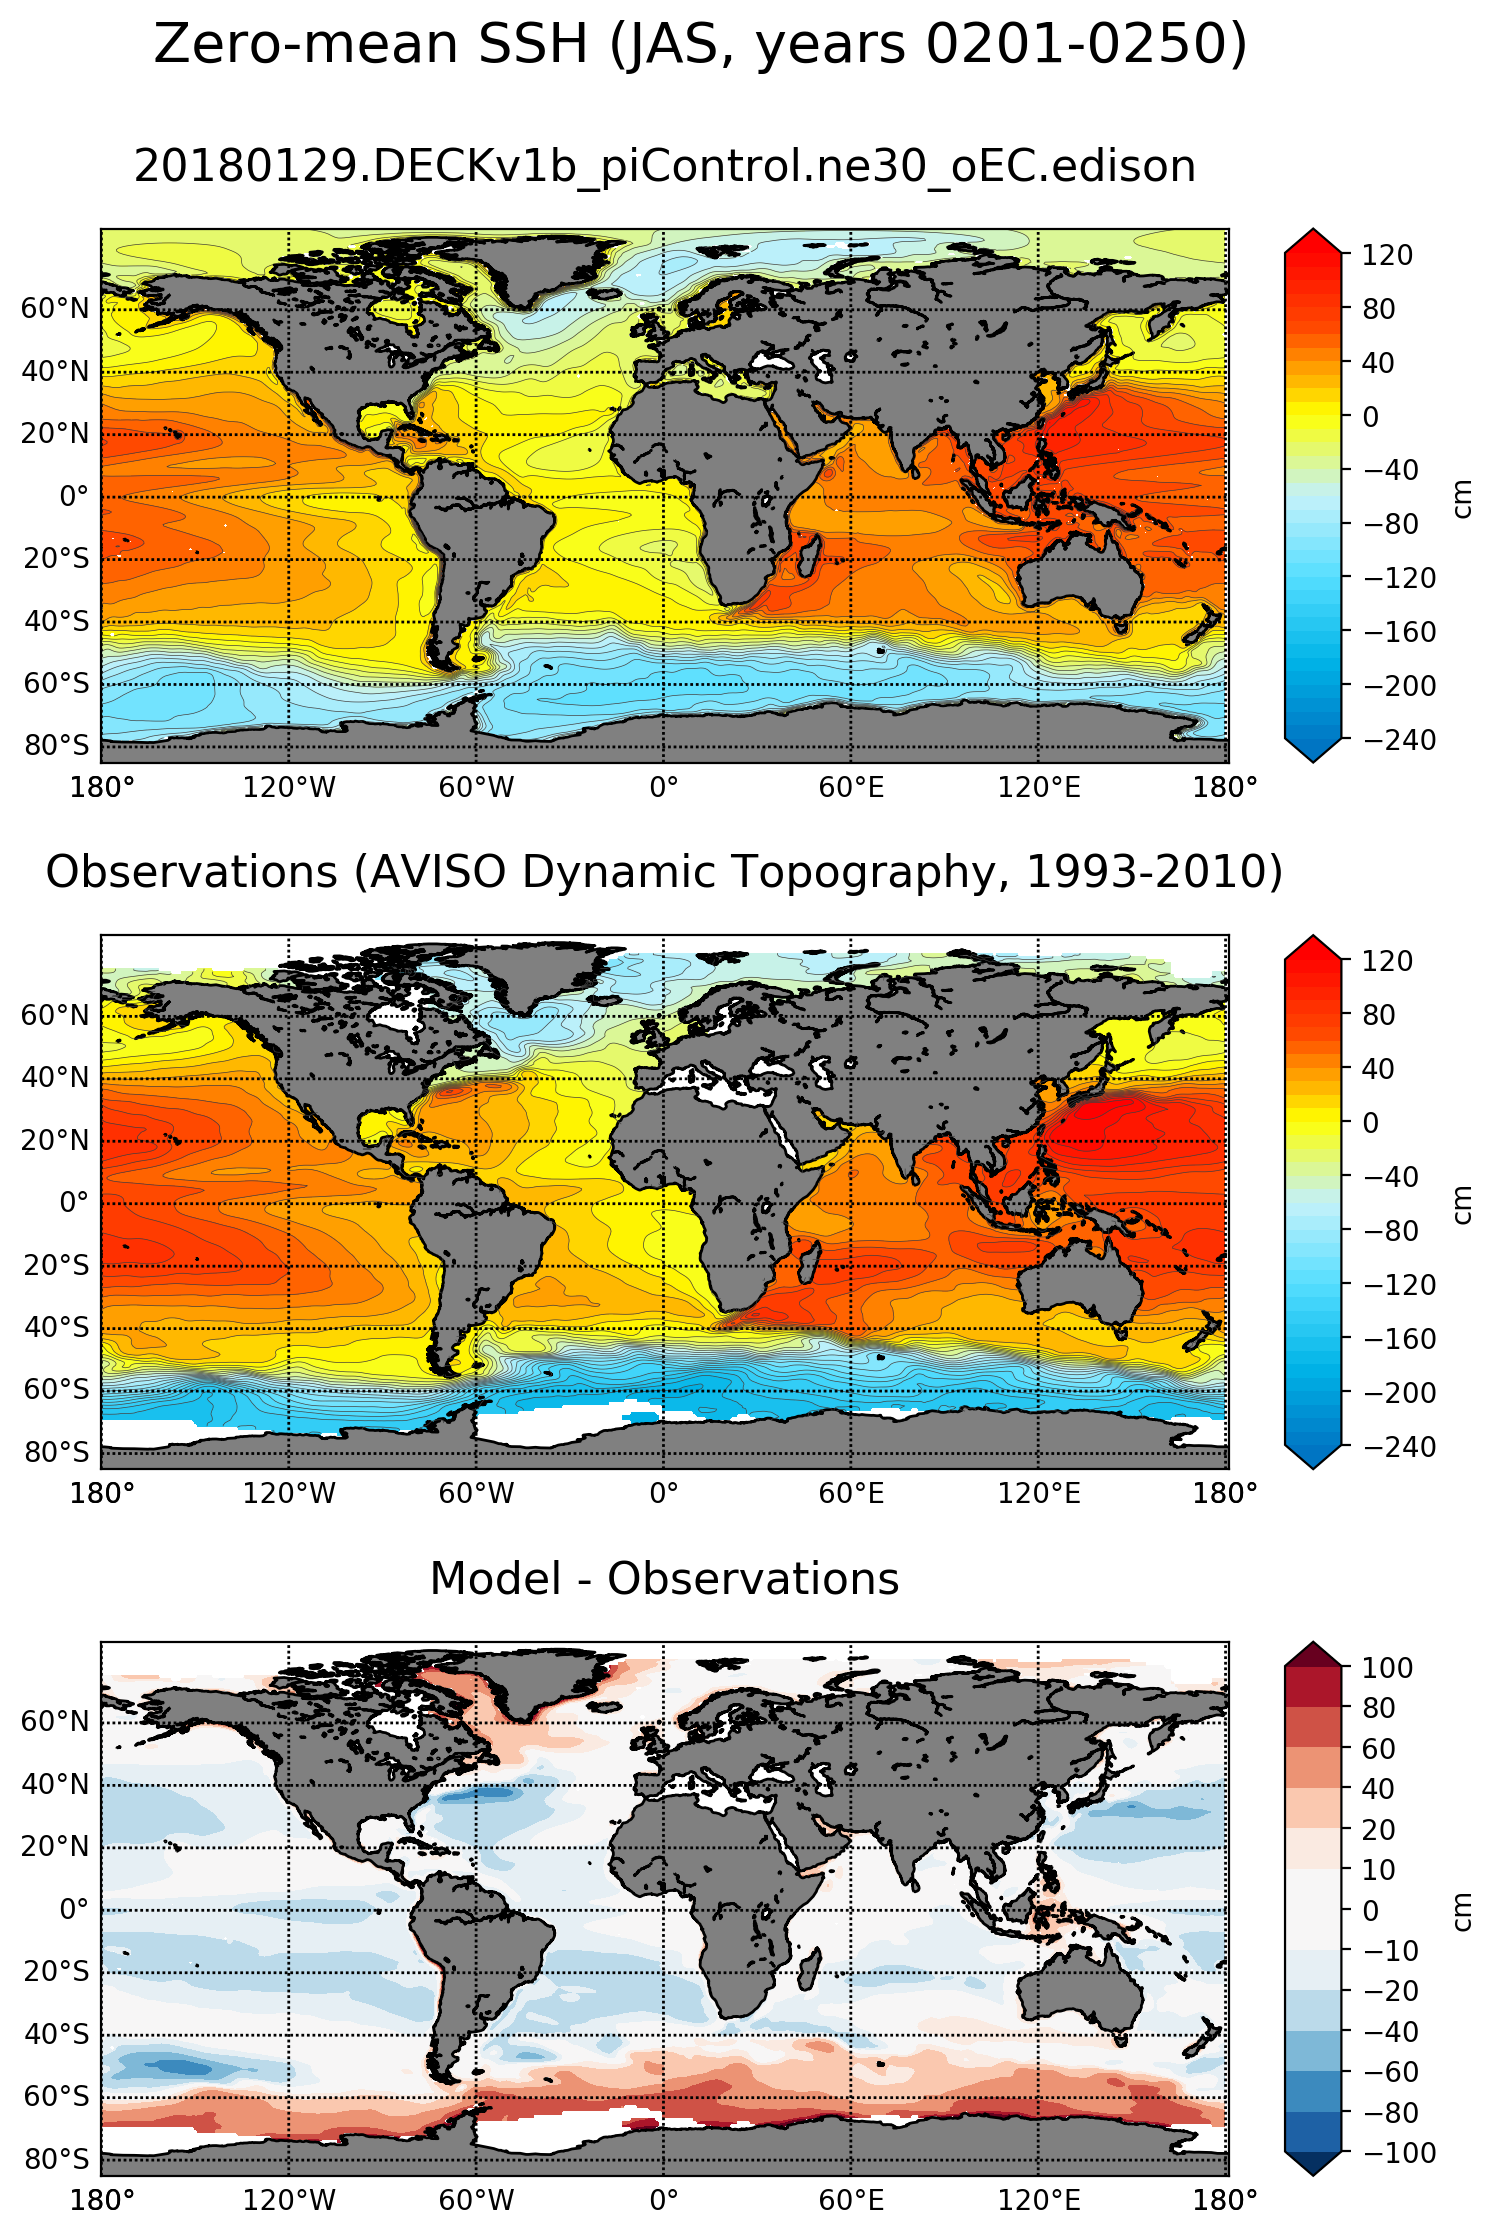
JAS
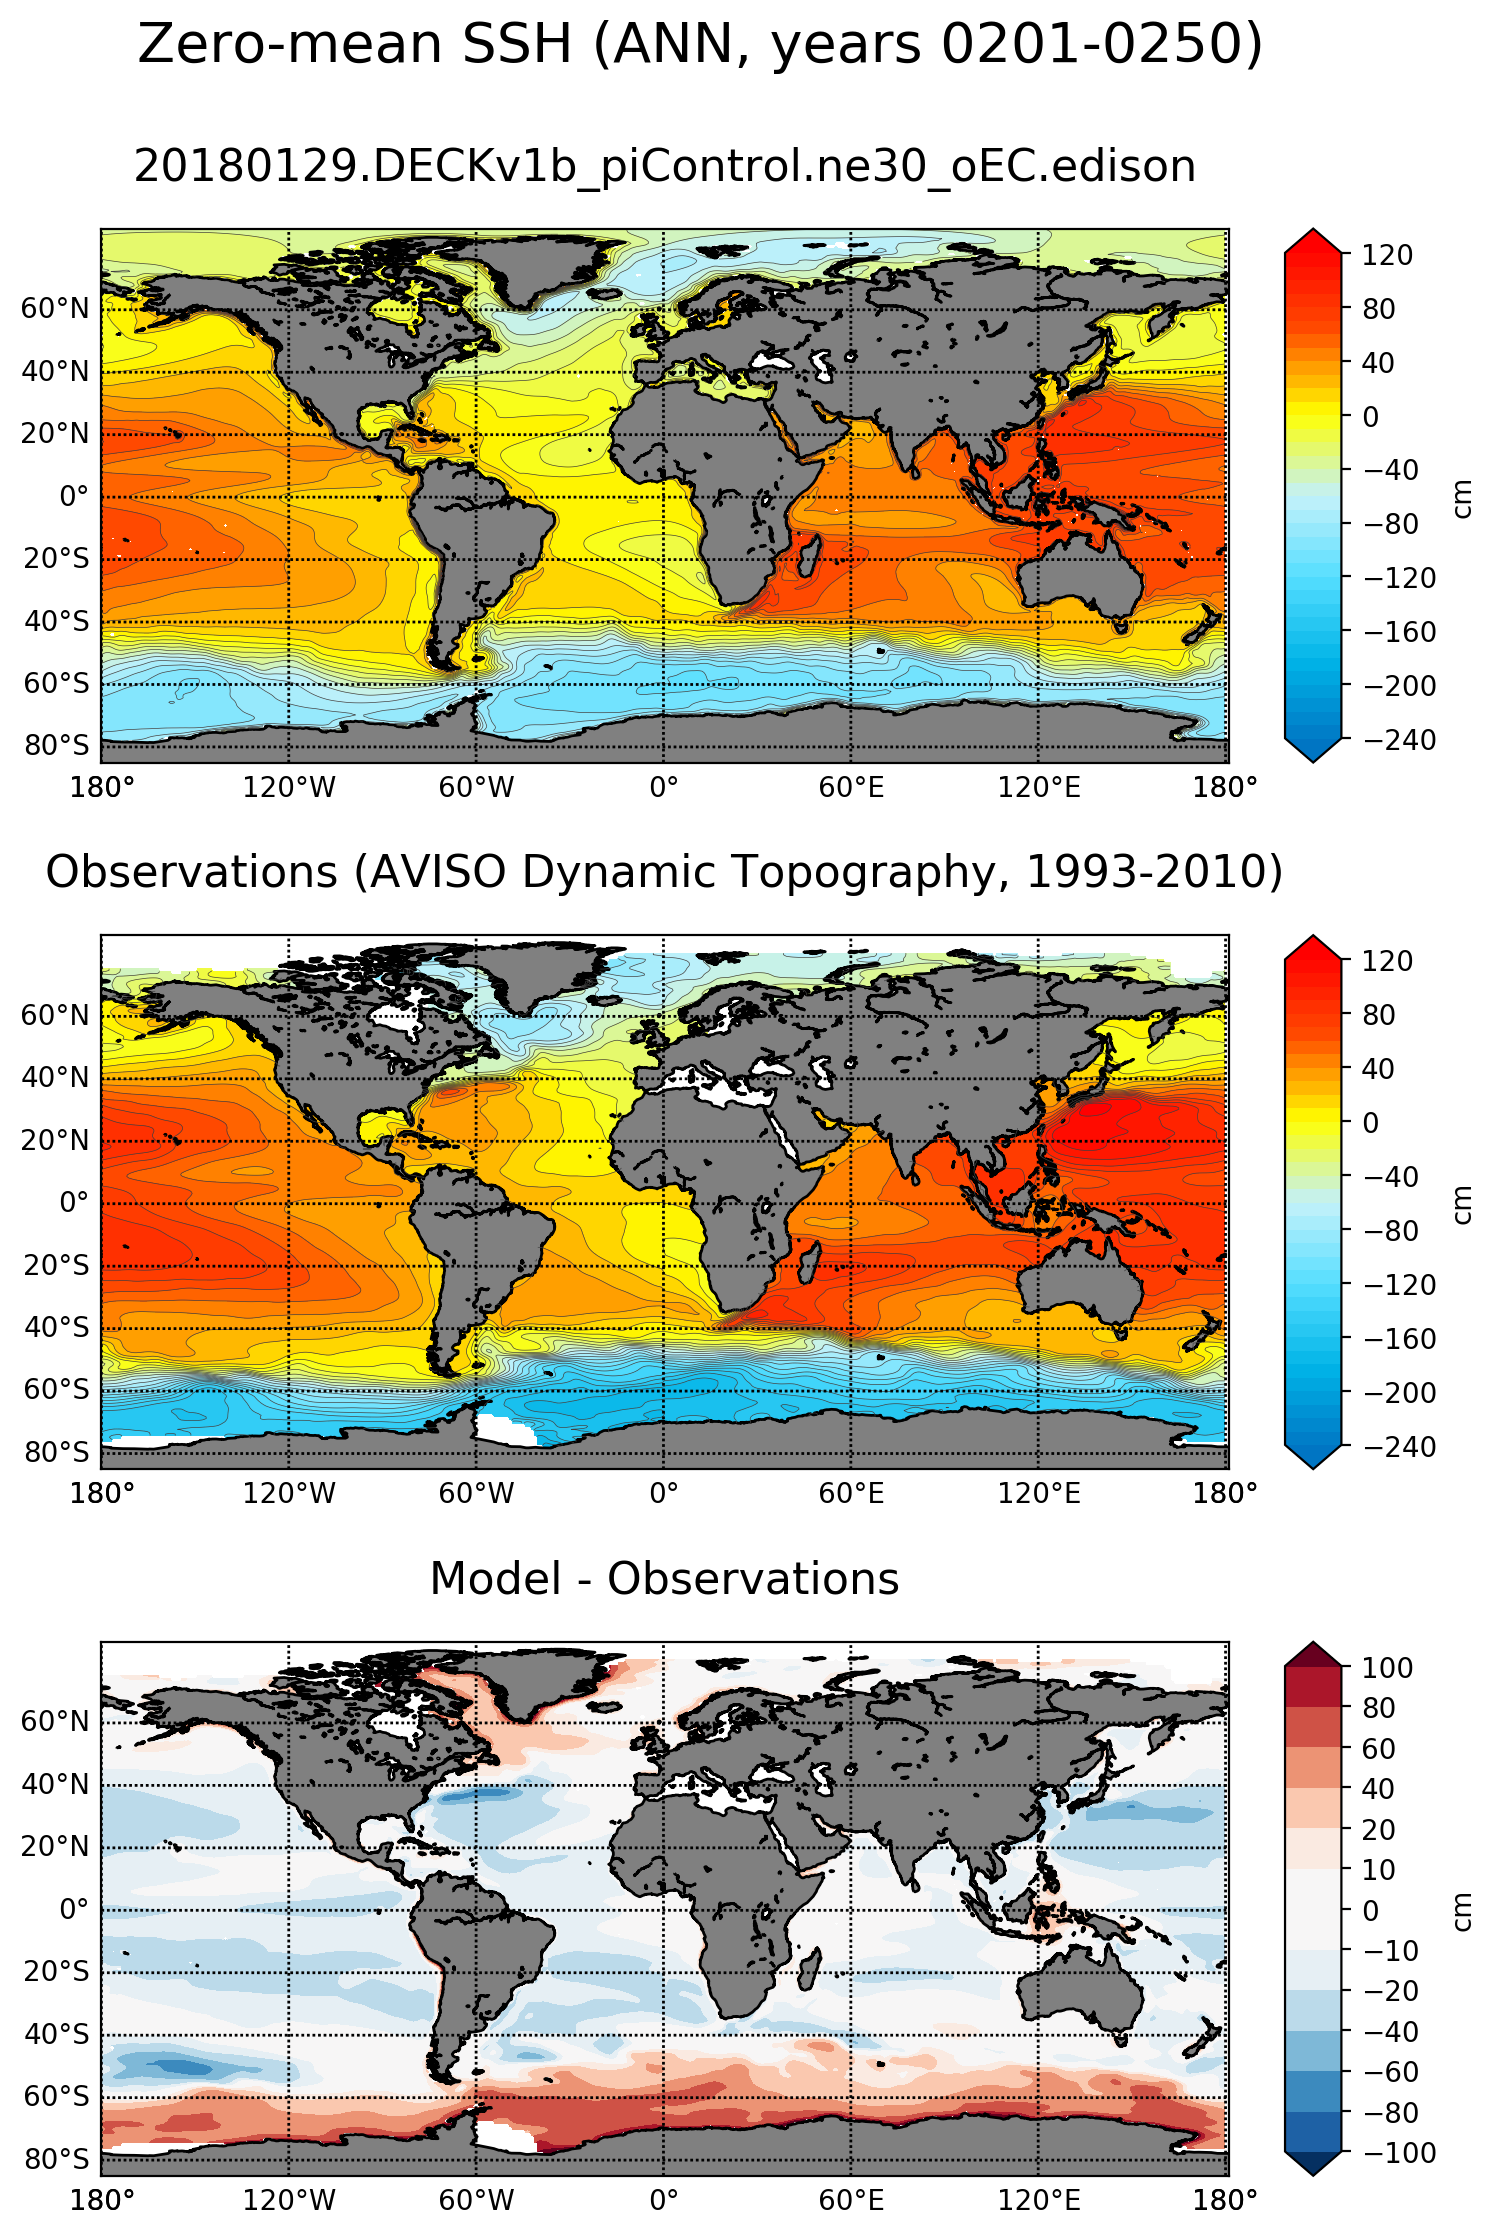
ANN

ANN

ANN

ANN

ANN
State Estimate: SOSE

ANN surface

ANN z=-200 m

ANN z=-400 m

ANN z=-600 m

ANN z=-800 m

ANN floor

JFM surface

JFM z=-200 m

JFM z=-400 m

JFM z=-600 m

JFM z=-800 m

JFM floor

JAS surface

JAS z=-200 m

JAS z=-400 m

JAS z=-600 m

JAS z=-800 m

JAS floor
State Estimate: SOSE

ANN surface

ANN z=-200 m

ANN z=-400 m

ANN z=-600 m

ANN z=-800 m

ANN floor

JFM surface

JFM z=-200 m

JFM z=-400 m

JFM z=-600 m

JFM z=-800 m

JFM floor

JAS surface

JAS z=-200 m

JAS z=-400 m

JAS z=-600 m

JAS z=-800 m

JAS floor
State Estimate: SOSE

ANN

JFM

JAS
Roemmich-Gilson Climatology: Argo

ANN surface

ANN z=-25 m

ANN z=-50 m

ANN z=-100 m

ANN z=-150 m

ANN z=-200 m

ANN z=-400 m

ANN z=-800 m

ANN z=-1500 m

JAS surface

JAS z=-25 m

JAS z=-50 m

JAS z=-100 m

JAS z=-150 m

JAS z=-200 m

JAS z=-400 m

JAS z=-800 m

JAS z=-1500 m

JFM surface

JFM z=-25 m

JFM z=-50 m

JFM z=-100 m

JFM z=-150 m

JFM z=-200 m

JFM z=-400 m

JFM z=-800 m

JFM z=-1500 m
Roemmich-Gilson Climatology: Argo

ANN surface

ANN z=-25 m

ANN z=-50 m

ANN z=-100 m

ANN z=-150 m

ANN z=-200 m

ANN z=-400 m

ANN z=-600 m

ANN z=-800 m

ANN z=-1500 m

JFM surface

JFM z=-25 m

JFM z=-50 m

JFM z=-100 m

JFM z=-150 m

JFM z=-200 m

JFM z=-400 m

JFM z=-600 m

JFM z=-800 m

JFM z=-1500 m

JAS surface

JAS z=-25 m

JAS z=-50 m

JAS z=-100 m

JAS z=-150 m

JAS z=-200 m

JAS z=-400 m

JAS z=-600 m

JAS z=-800 m

JAS z=-1500 m
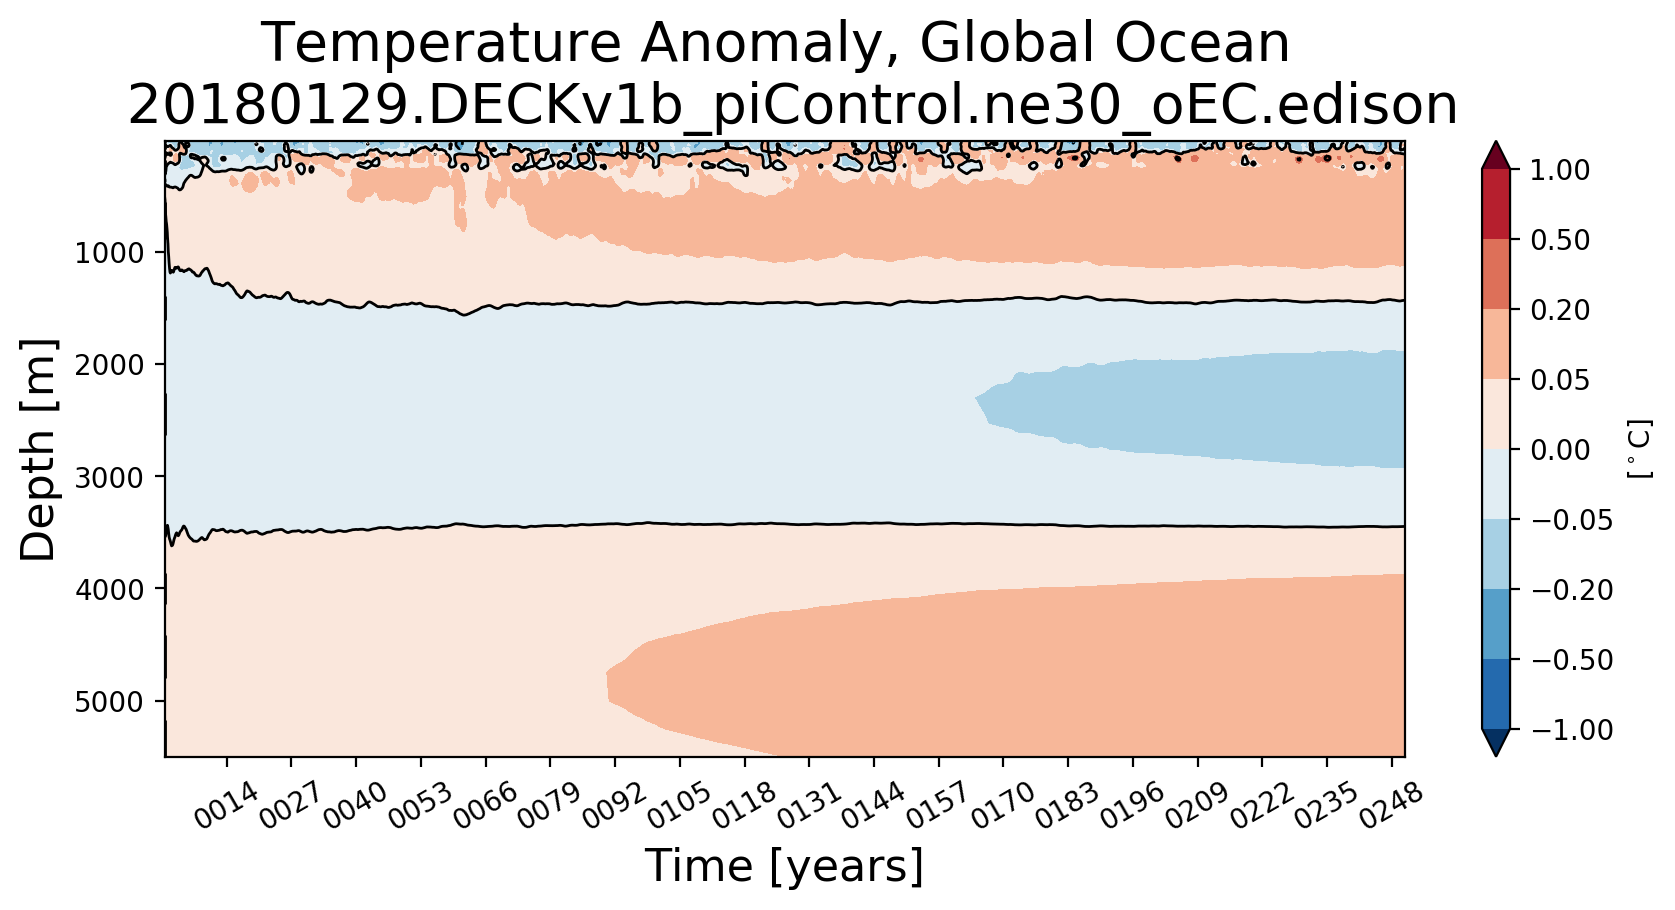
global ΔT
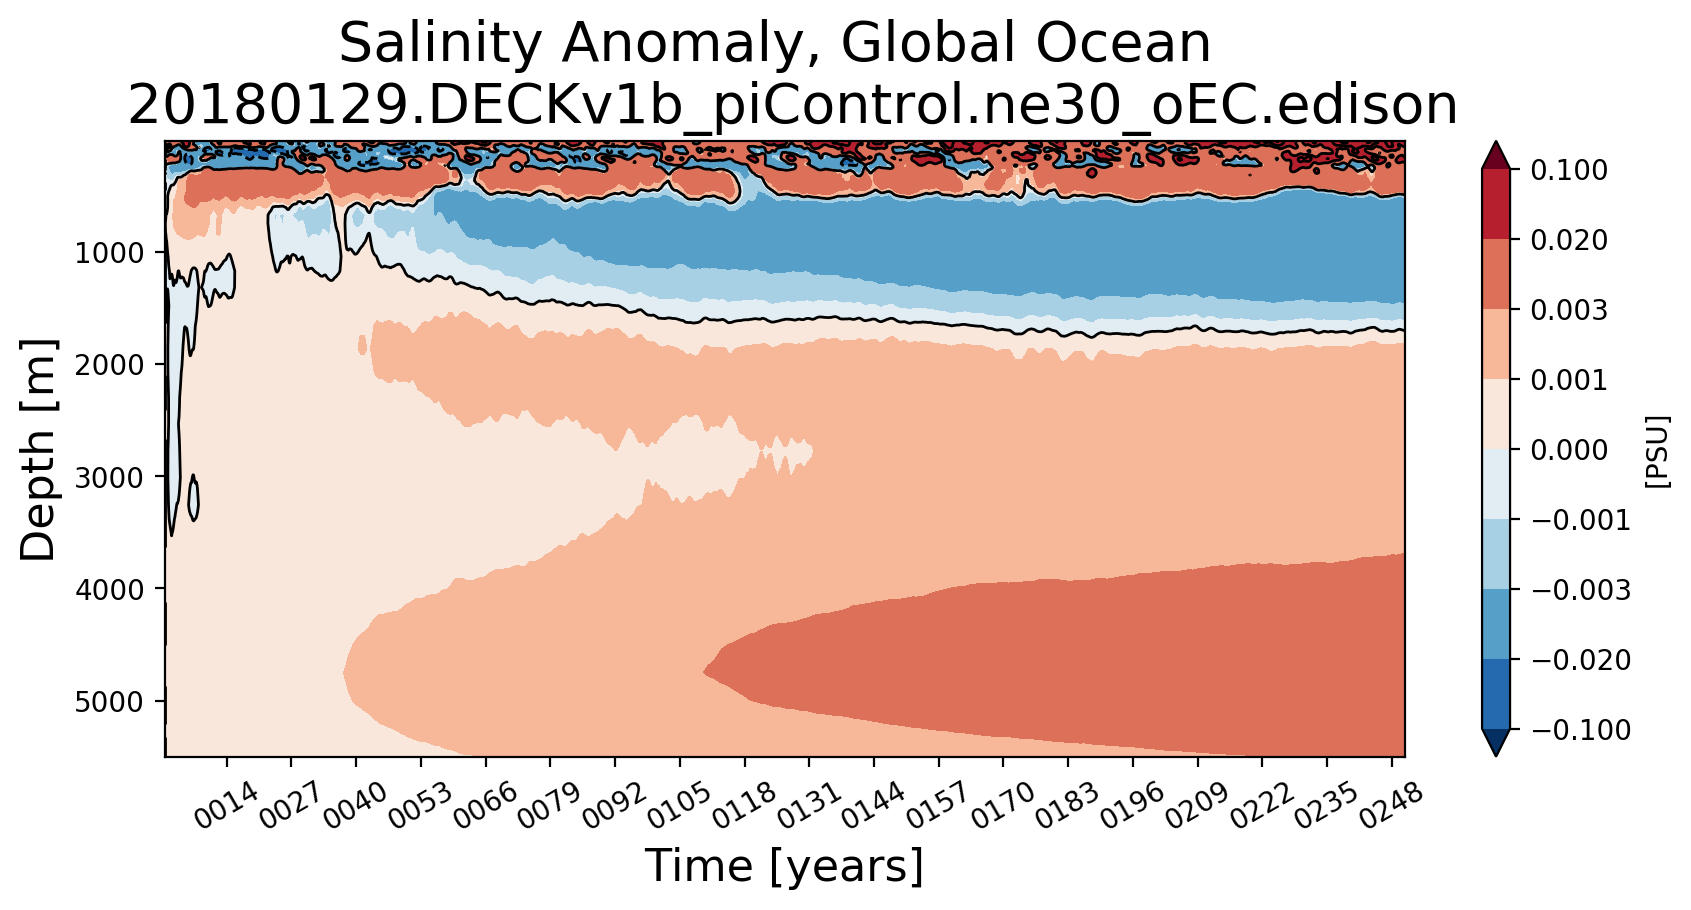
global ΔS
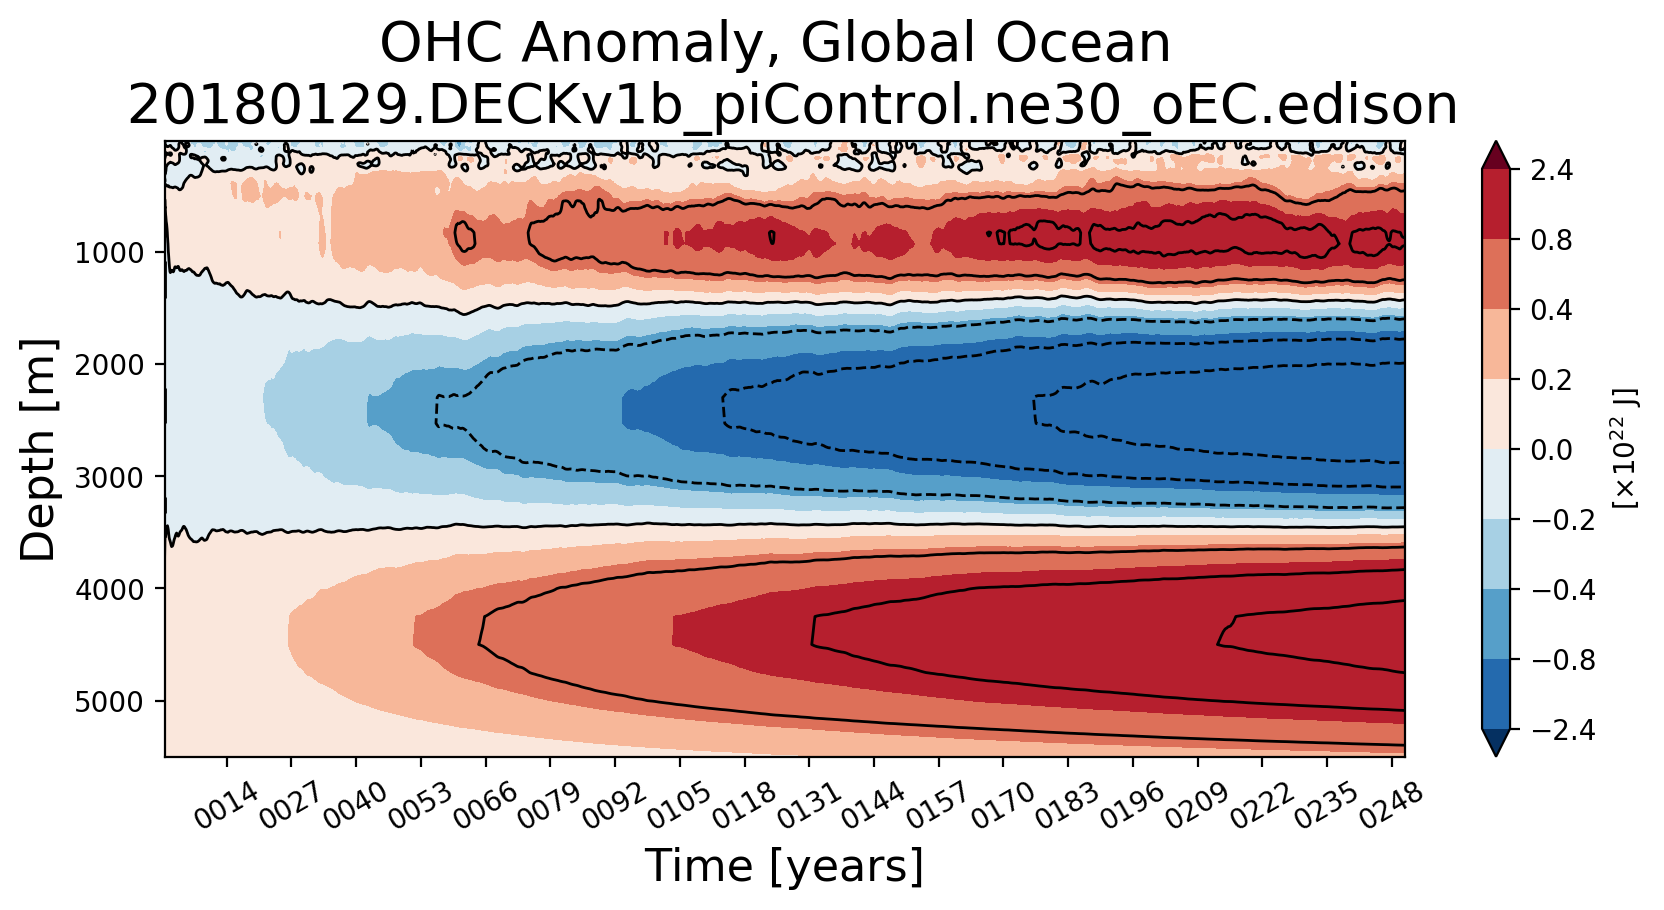
global ΔOHC
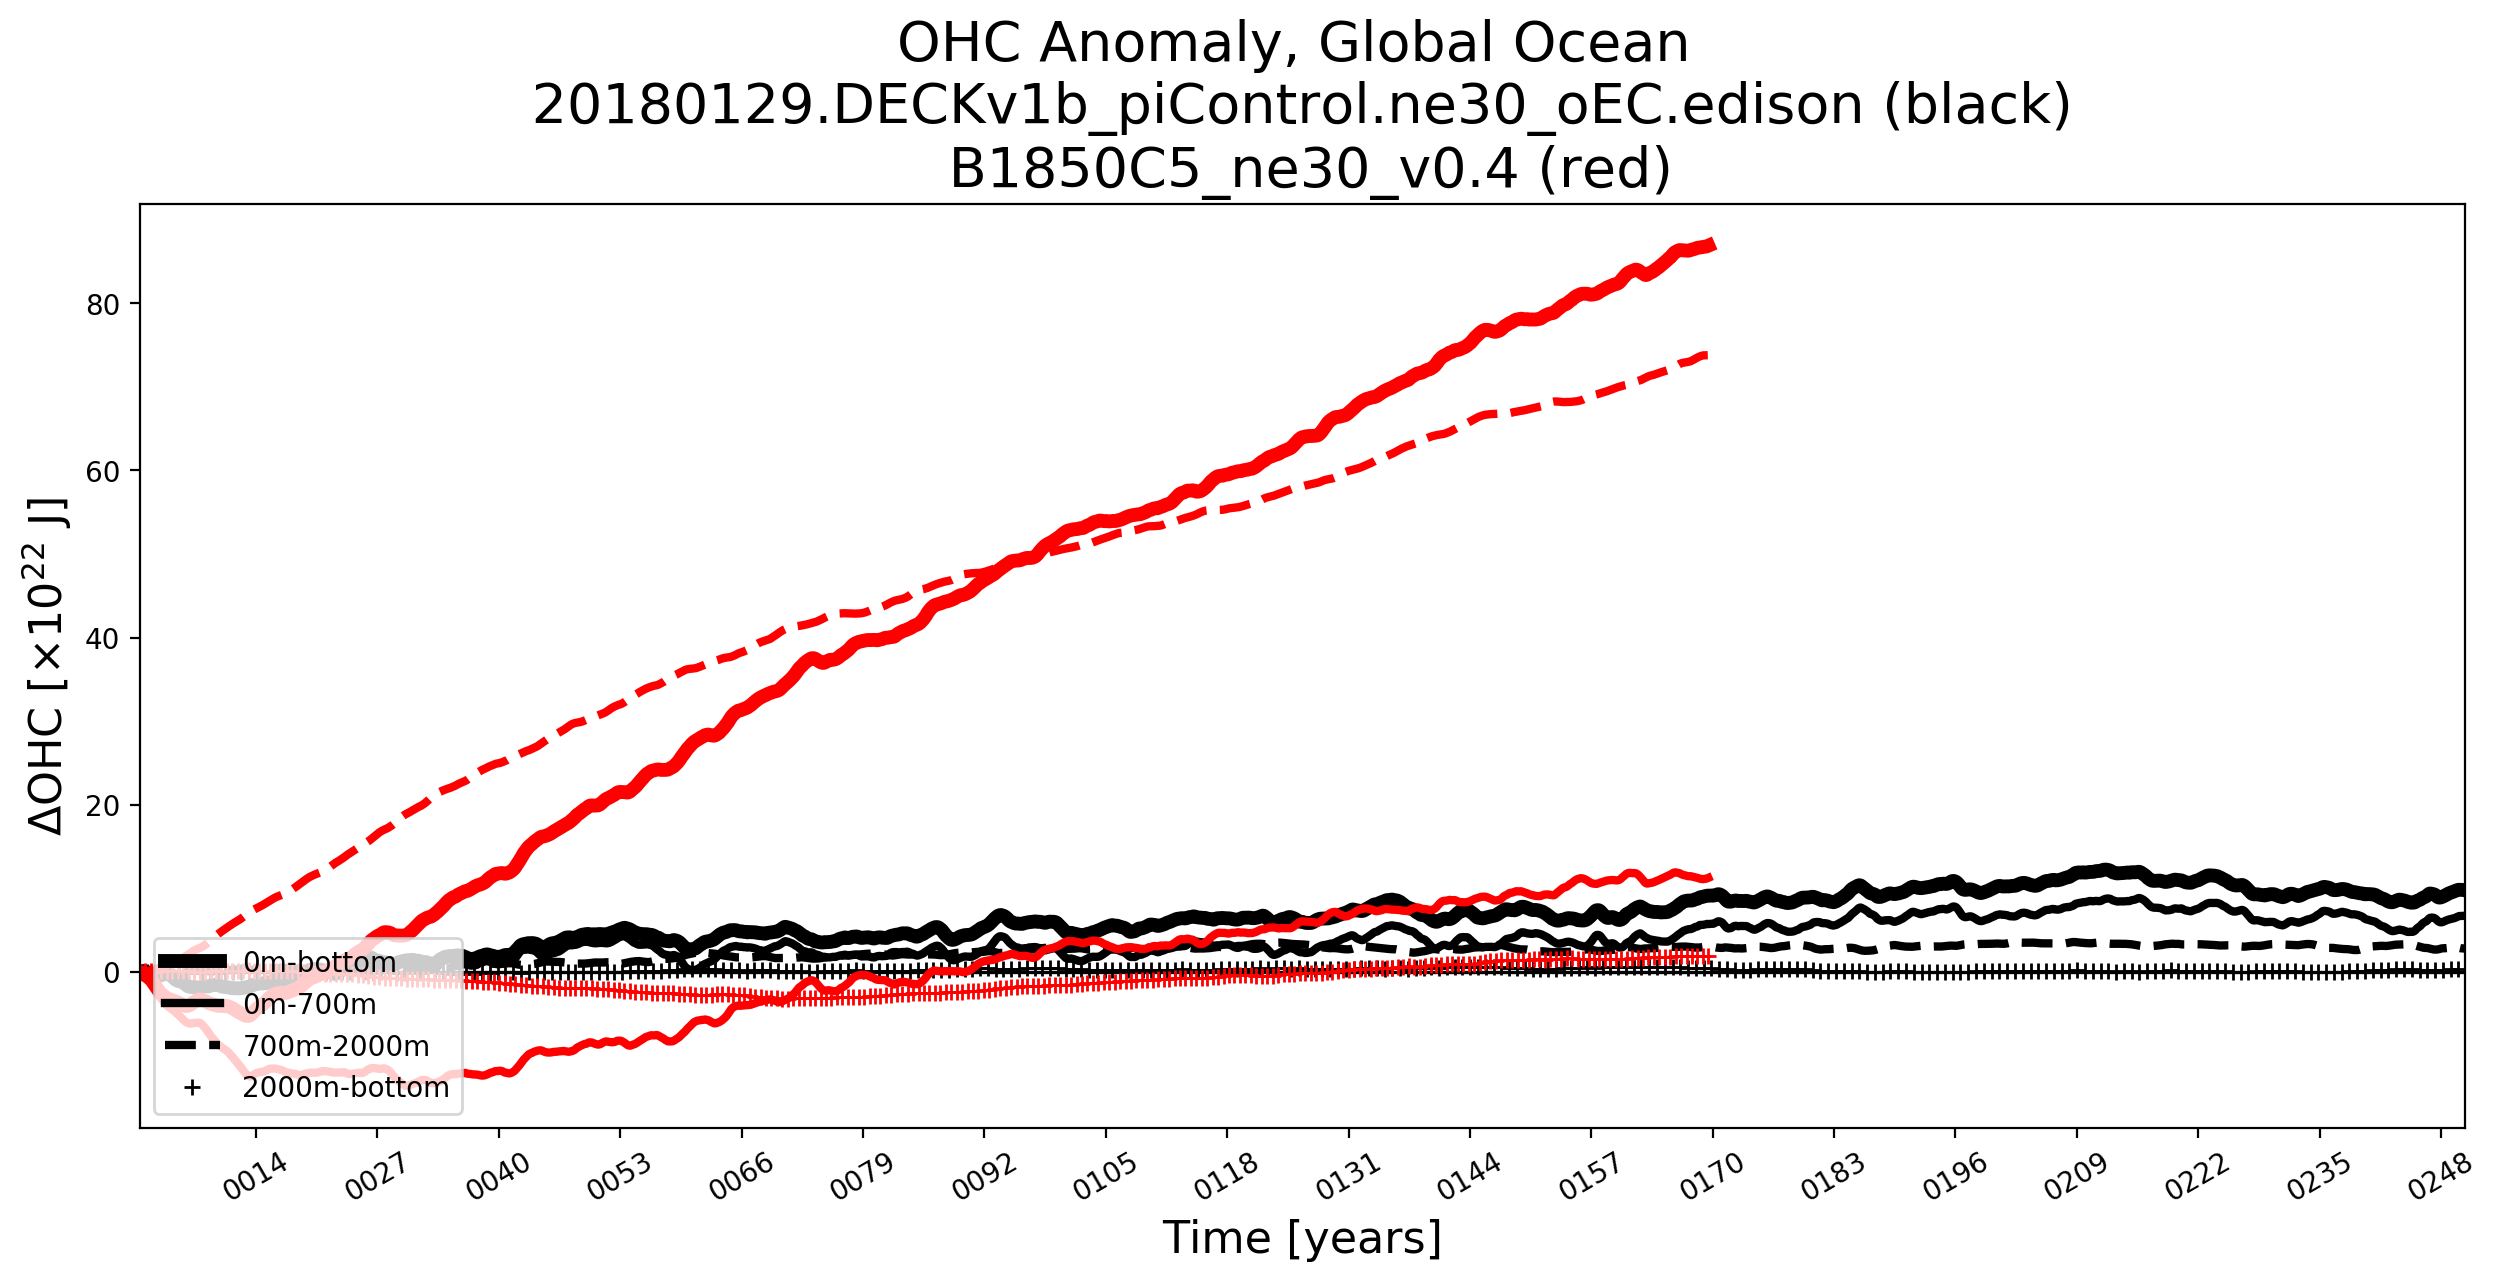
global ΔOHC
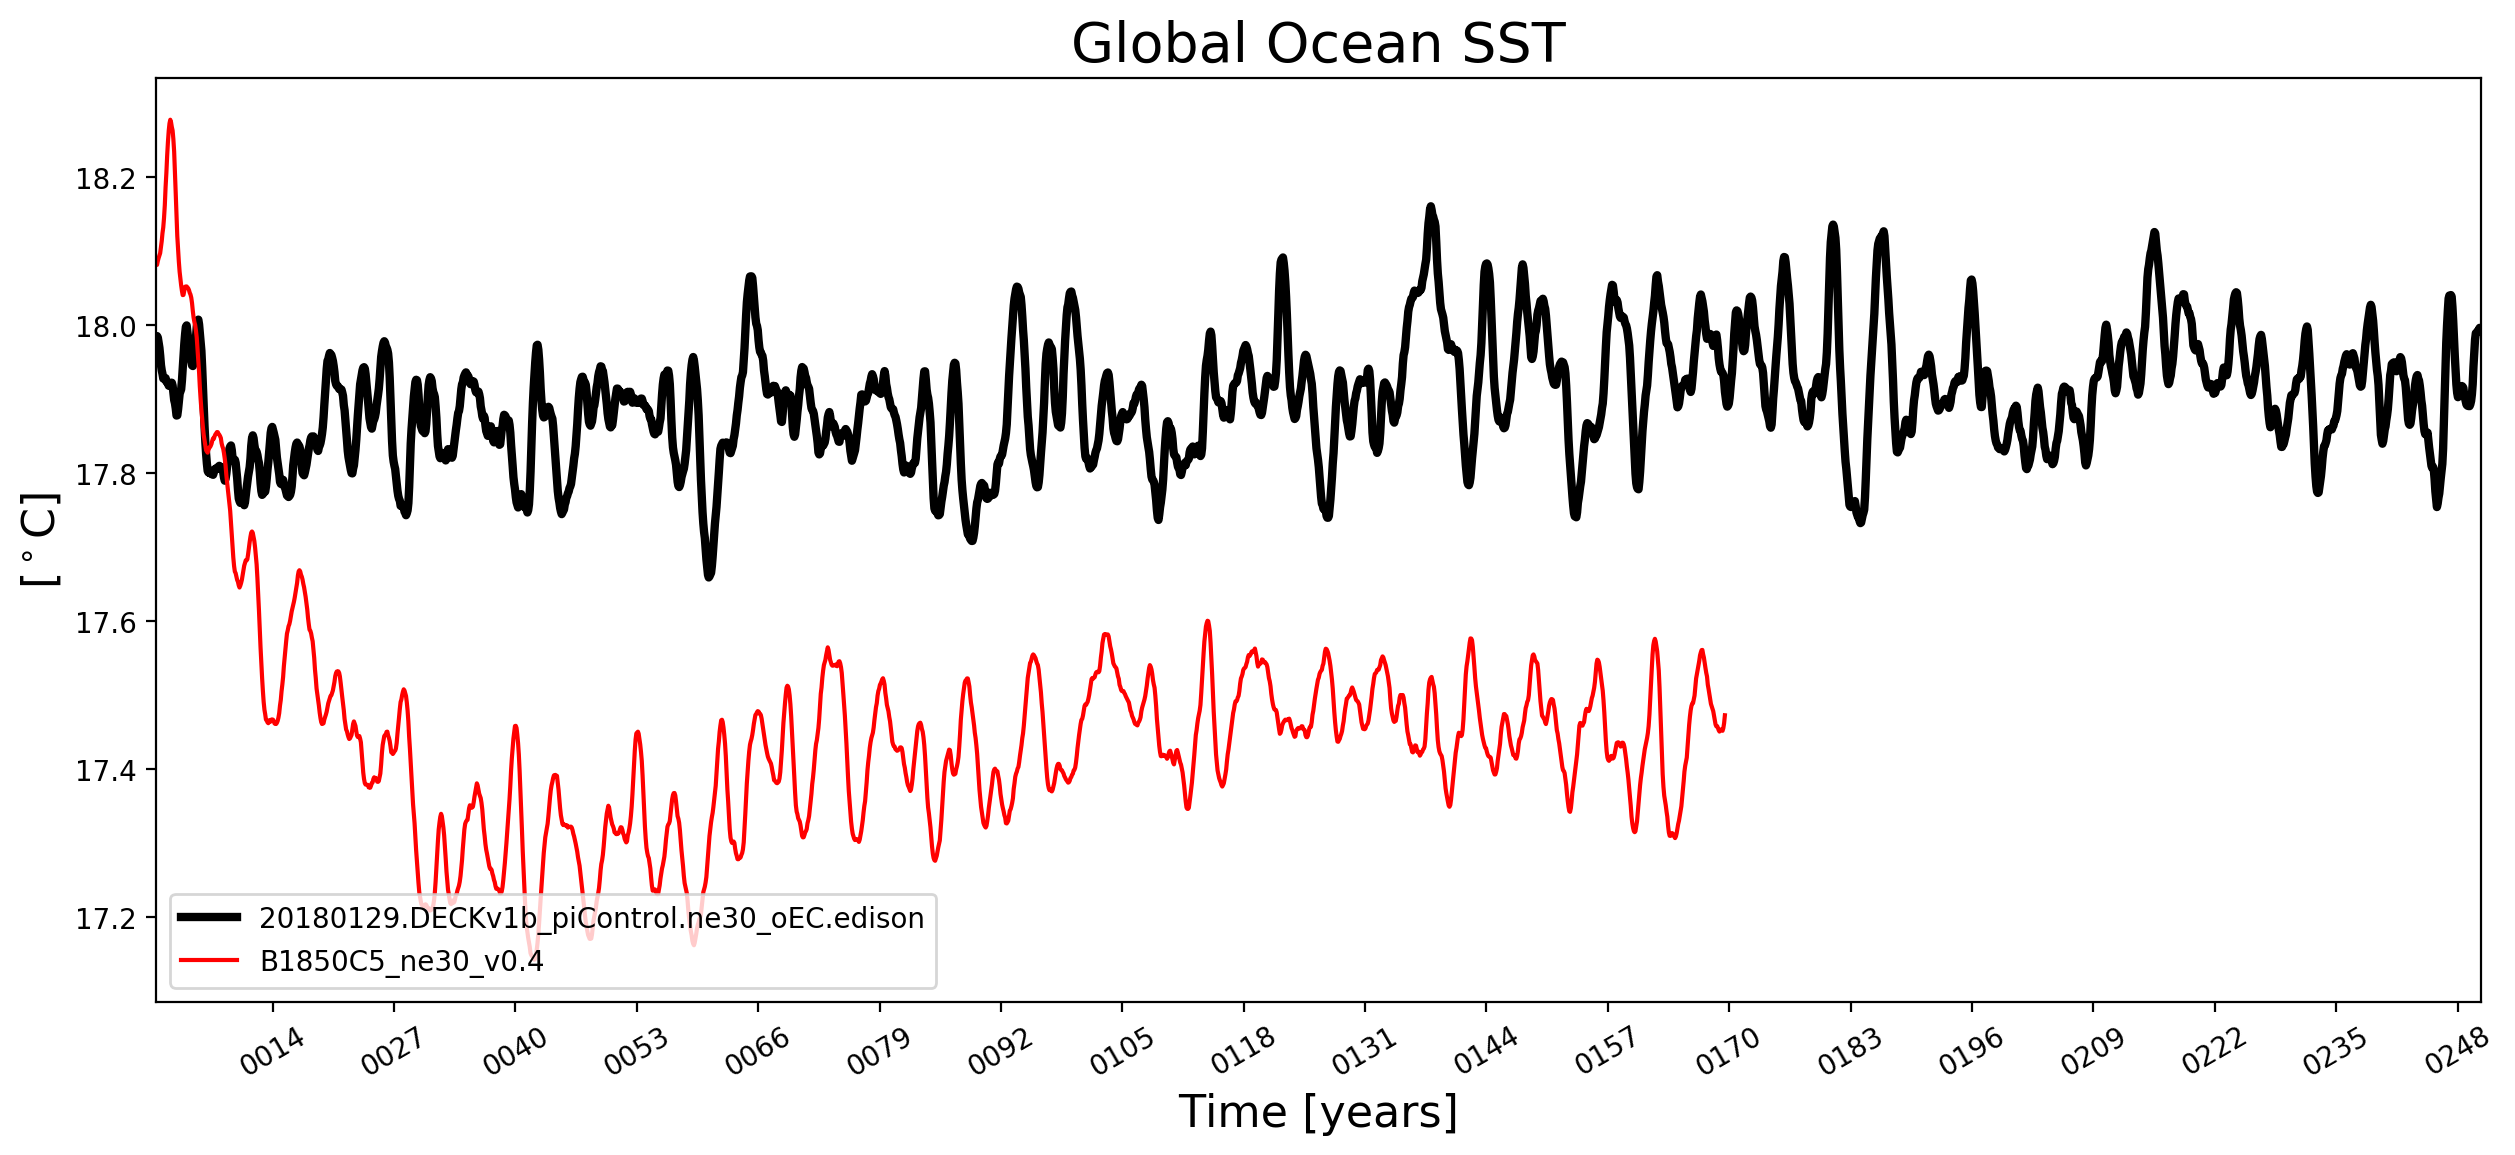
global SST
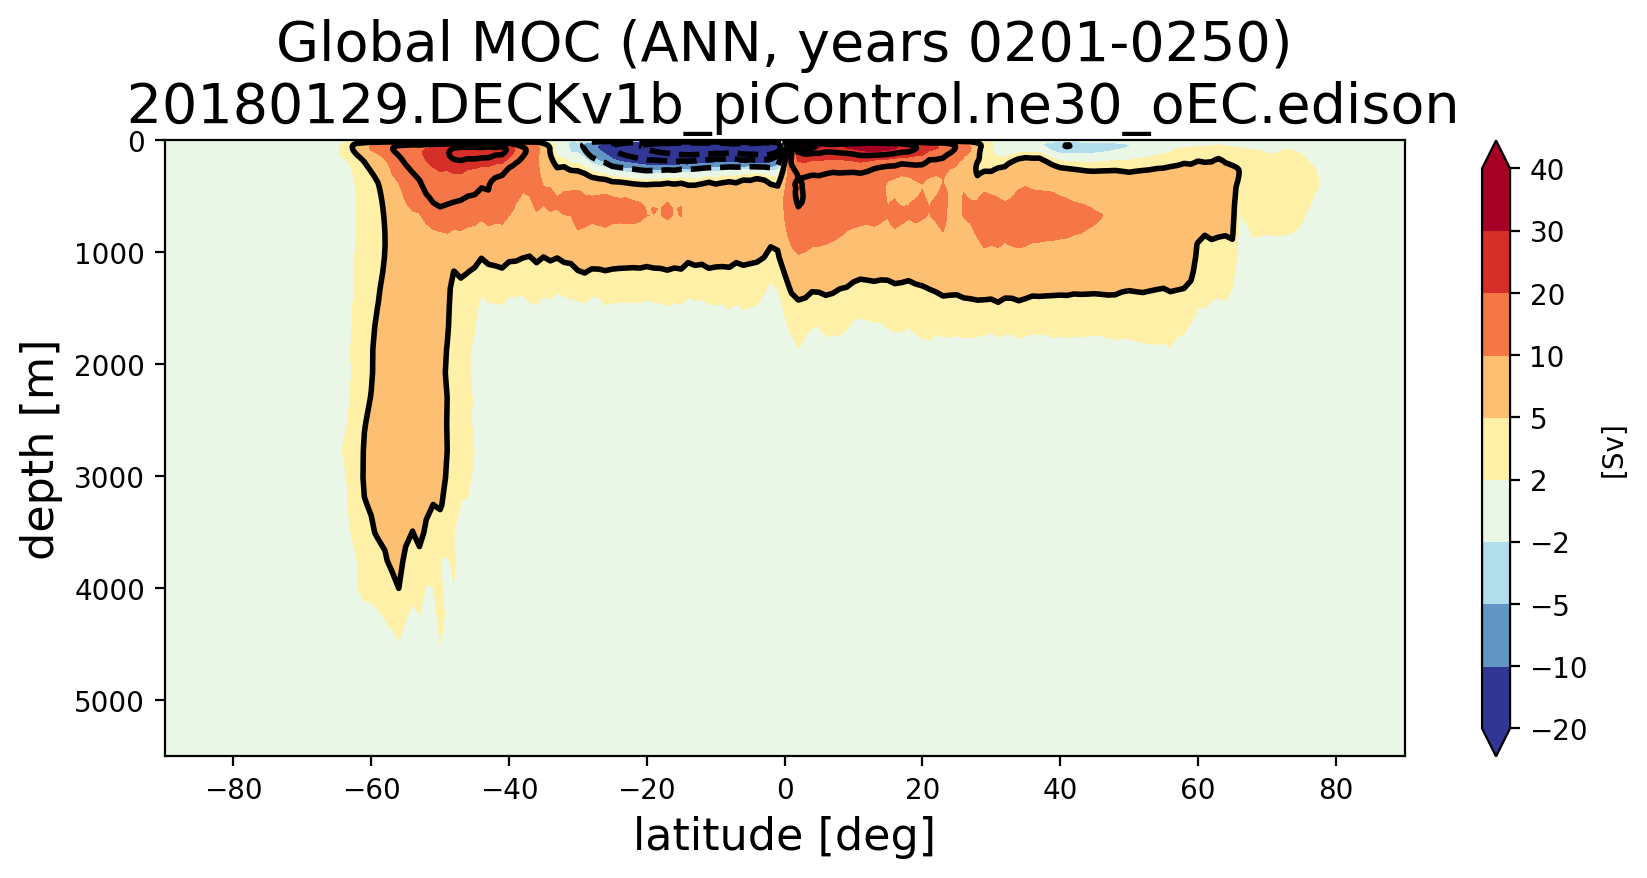
Global
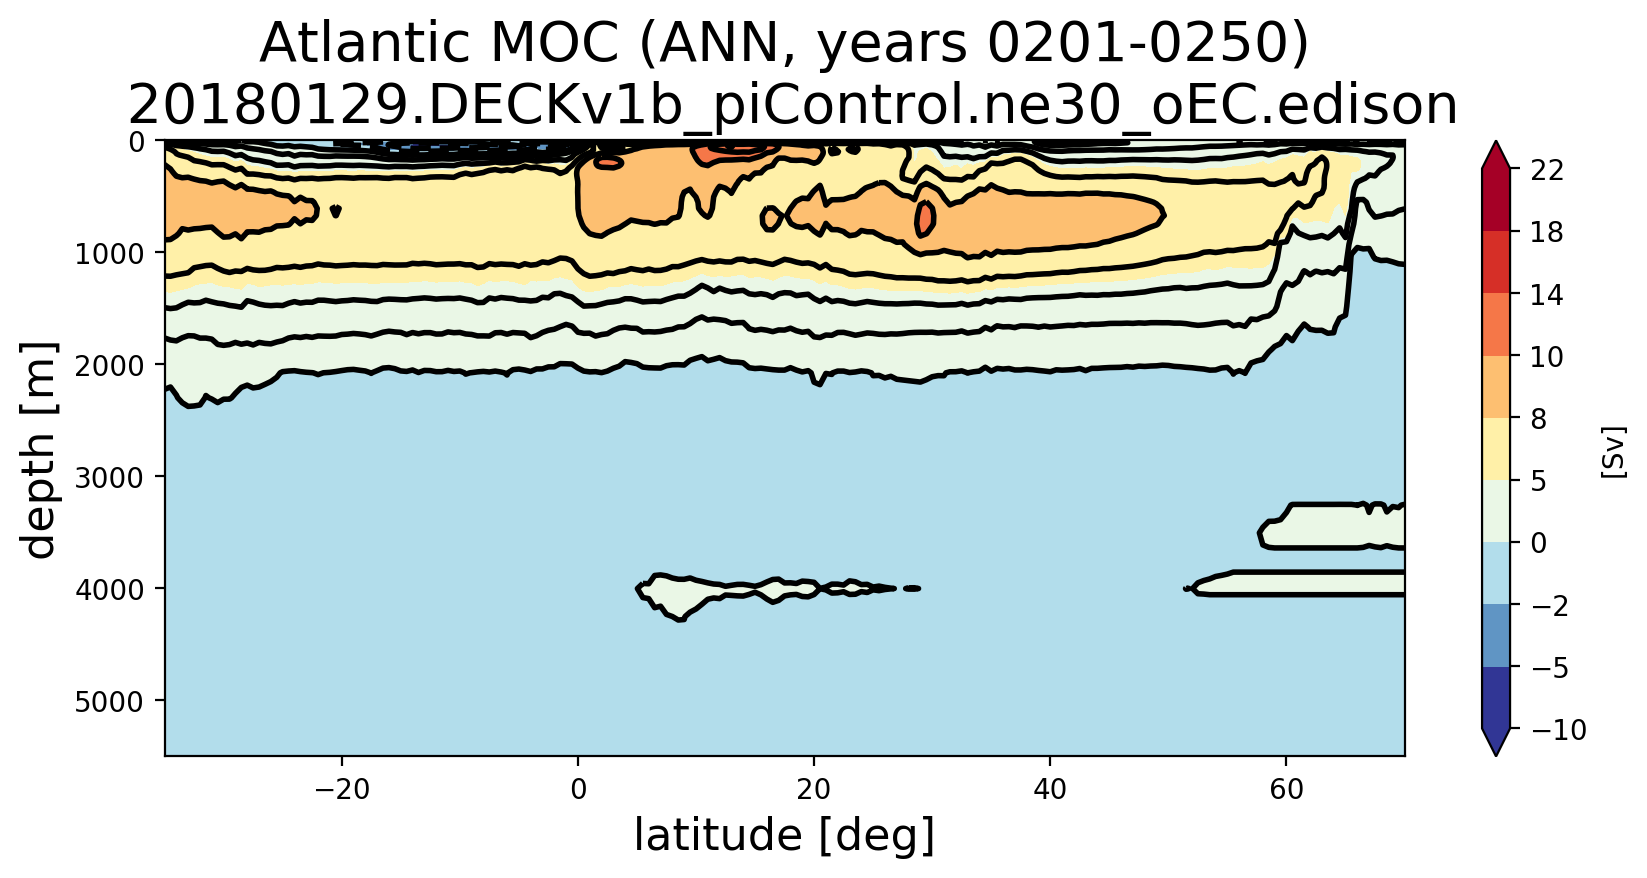
Atlantic
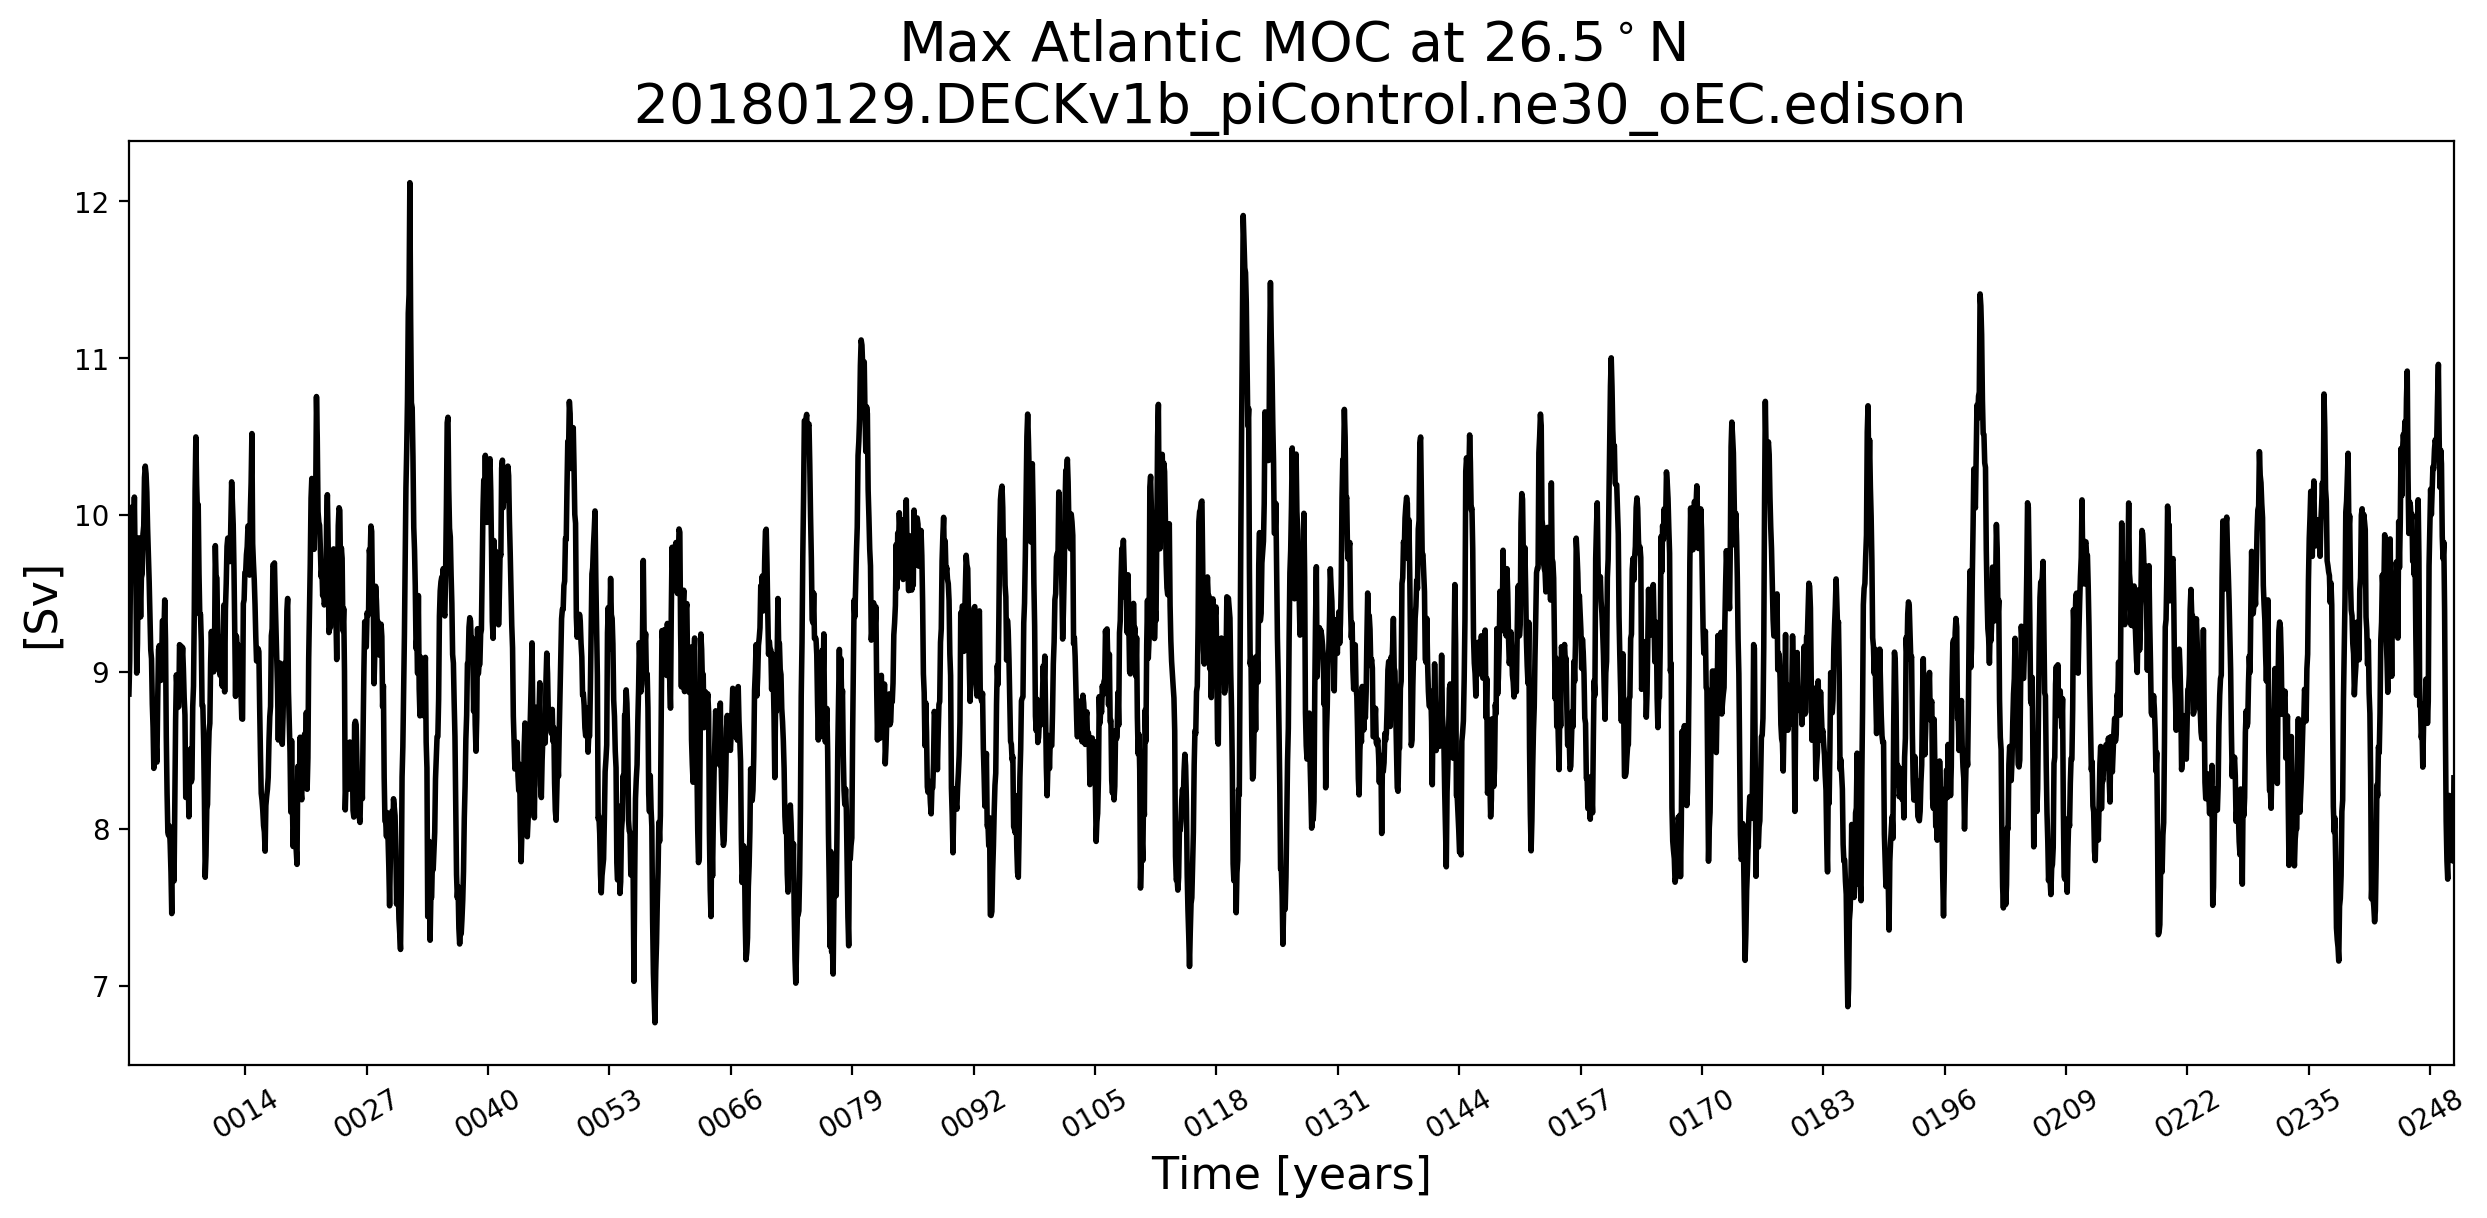
Time Series
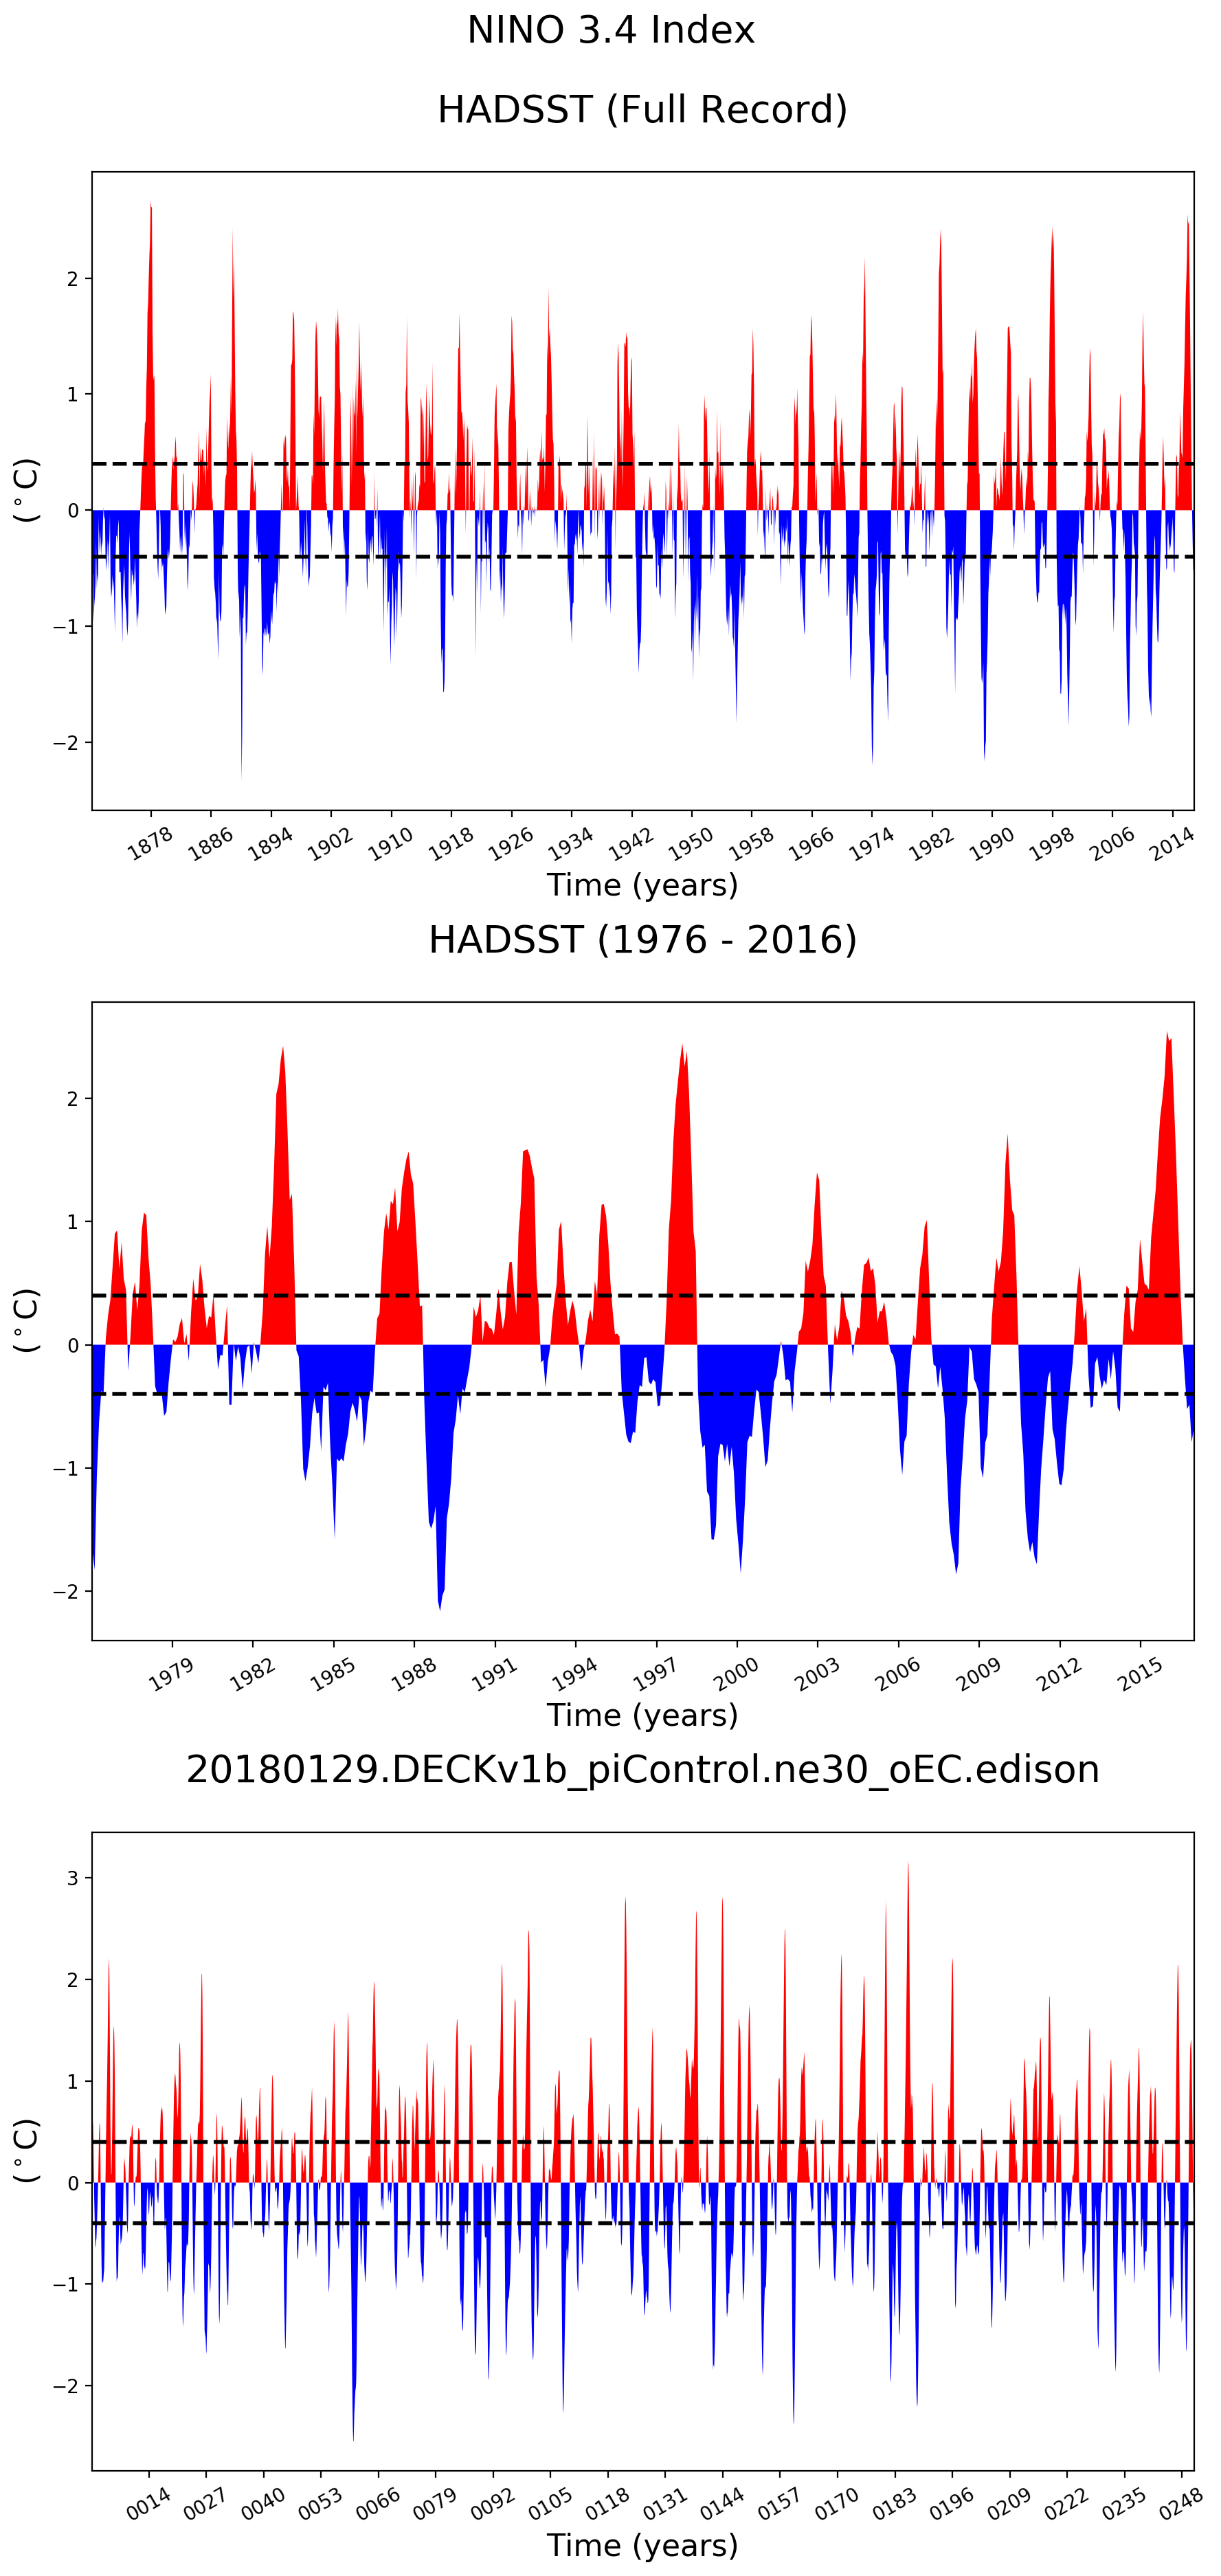
Time Series
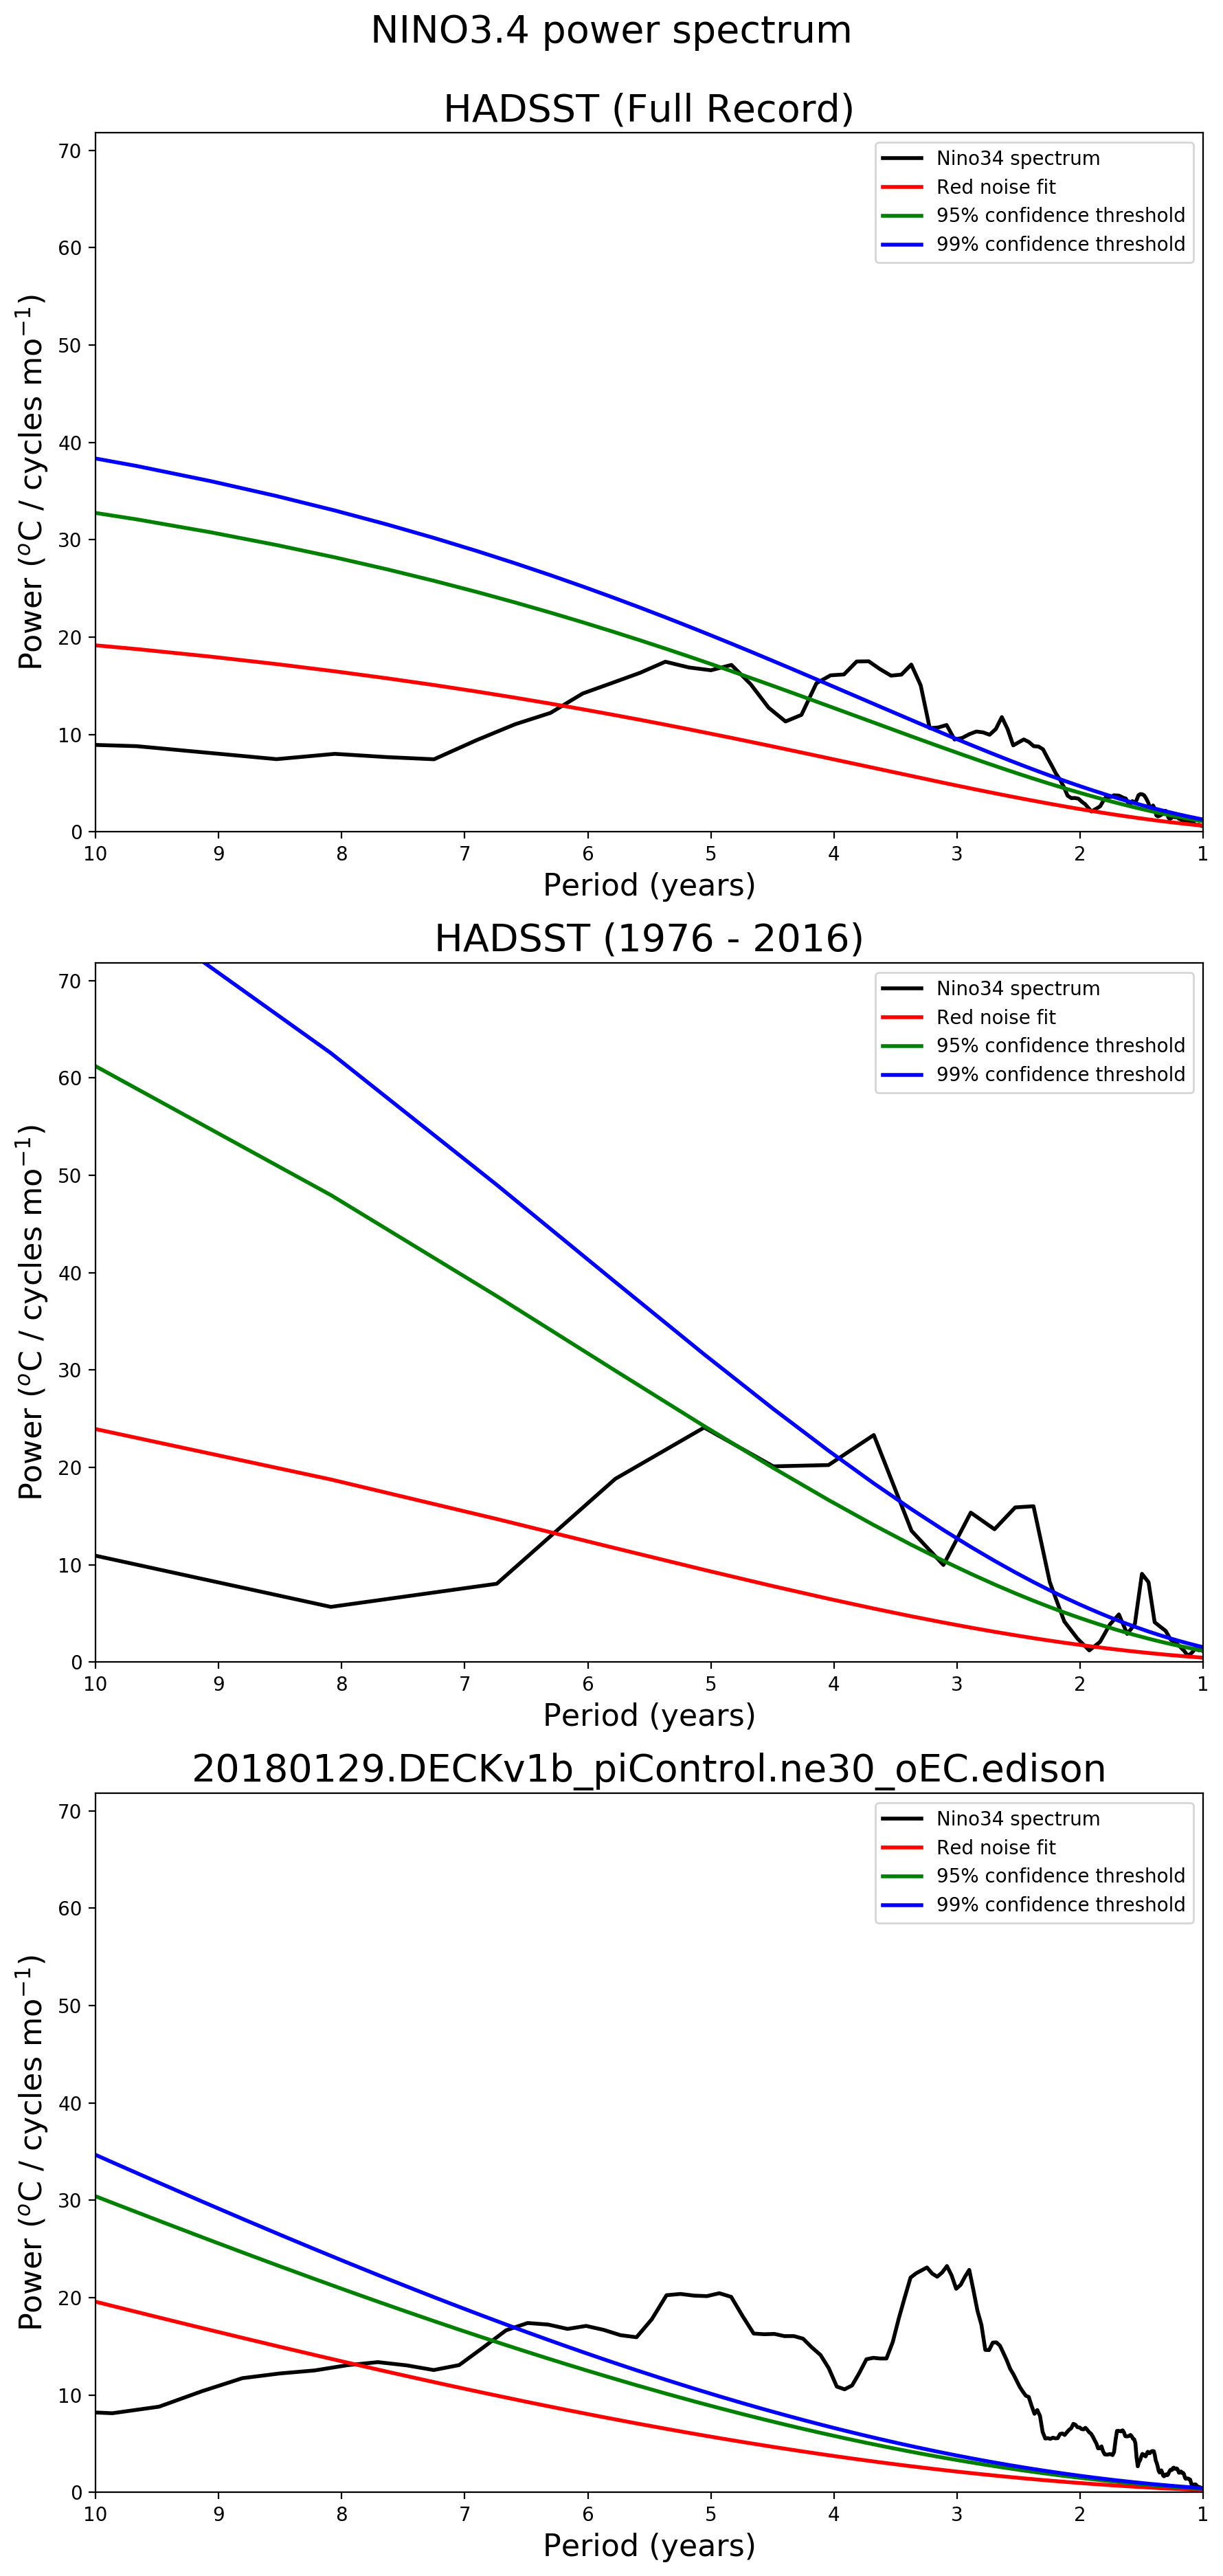
Spectra