Mean State
Download Data |
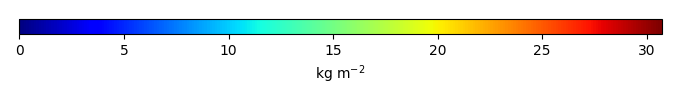
Period Mean (original grids) seas [Pg] |
Period Mean (original grids) [Pg] |
Period Mean (original grids) boas [Pg] |
Period Mean (original grids) tena [Pg] |
Period Mean (original grids) mide [Pg] |
Period Mean (original grids) shsa [Pg] |
Period Mean (original grids) aust [Pg] |
Period Mean (original grids) nhaf [Pg] |
Period Mean (original grids) ceam [Pg] |
Period Mean (original grids) ceas [Pg] |
Period Mean (original grids) eqas [Pg] |
Period Mean (original grids) bona [Pg] |
Period Mean (original grids) euro [Pg] |
Period Mean (original grids) shaf [Pg] |
Period Mean (original grids) nhsa [Pg] |
Model Period Mean (intersection) tena [Pg] |
Model Period Mean (intersection) seas [Pg] |
Model Period Mean (intersection) aust [Pg] |
Model Period Mean (intersection) eqas [Pg] |
Model Period Mean (intersection) ceam [Pg] |
Model Period Mean (intersection) nhaf [Pg] |
Model Period Mean (intersection) nhsa [Pg] |
Model Period Mean (intersection) ceas [Pg] |
Model Period Mean (intersection) shaf [Pg] |
Model Period Mean (intersection) mide [Pg] |
Model Period Mean (intersection) bona [Pg] |
Model Period Mean (intersection) boas [Pg] |
Model Period Mean (intersection) [Pg] |
Model Period Mean (intersection) euro [Pg] |
Model Period Mean (intersection) shsa [Pg] |
Model Period Mean (complement) shaf [Pg] |
Model Period Mean (complement) seas [Pg] |
Model Period Mean (complement) aust [Pg] |
Model Period Mean (complement) bona [Pg] |
Model Period Mean (complement) [Pg] |
Model Period Mean (complement) euro [Pg] |
Model Period Mean (complement) eqas [Pg] |
Model Period Mean (complement) boas [Pg] |
Model Period Mean (complement) nhaf [Pg] |
Model Period Mean (complement) shsa [Pg] |
Model Period Mean (complement) mide [Pg] |
Model Period Mean (complement) tena [Pg] |
Model Period Mean (complement) ceam [Pg] |
Model Period Mean (complement) ceas [Pg] |
Model Period Mean (complement) nhsa [Pg] |
Benchmark Period Mean (intersection) euro [Pg] |
Benchmark Period Mean (intersection) mide [Pg] |
Benchmark Period Mean (intersection) nhsa [Pg] |
Benchmark Period Mean (intersection) tena [Pg] |
Benchmark Period Mean (intersection) bona [Pg] |
Benchmark Period Mean (intersection) boas [Pg] |
Benchmark Period Mean (intersection) [Pg] |
Benchmark Period Mean (intersection) eqas [Pg] |
Benchmark Period Mean (intersection) aust [Pg] |
Benchmark Period Mean (intersection) shsa [Pg] |
Benchmark Period Mean (intersection) nhaf [Pg] |
Benchmark Period Mean (intersection) shaf [Pg] |
Benchmark Period Mean (intersection) ceas [Pg] |
Benchmark Period Mean (intersection) ceam [Pg] |
Benchmark Period Mean (intersection) seas [Pg] |
Benchmark Period Mean (complement) aust [Pg] |
Benchmark Period Mean (complement) nhaf [Pg] |
Benchmark Period Mean (complement) seas [Pg] |
Benchmark Period Mean (complement) ceas [Pg] |
Benchmark Period Mean (complement) ceam [Pg] |
Benchmark Period Mean (complement) boas [Pg] |
Benchmark Period Mean (complement) eqas [Pg] |
Benchmark Period Mean (complement) [Pg] |
Benchmark Period Mean (complement) tena [Pg] |
Benchmark Period Mean (complement) bona [Pg] |
Benchmark Period Mean (complement) shsa [Pg] |
Benchmark Period Mean (complement) nhsa [Pg] |
Benchmark Period Mean (complement) euro [Pg] |
Benchmark Period Mean (complement) mide [Pg] |
Benchmark Period Mean (complement) shaf [Pg] |
Bias seas [kg m-2] |
Bias shsa [kg m-2] |
Bias nhsa [kg m-2] |
Bias eqas [kg m-2] |
Bias shaf [kg m-2] |
Bias boas [kg m-2] |
Bias nhaf [kg m-2] |
Bias ceas [kg m-2] |
Bias euro [kg m-2] |
Bias ceam [kg m-2] |
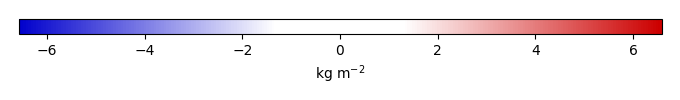
Bias [kg m-2] |
Bias aust [kg m-2] |
Bias bona [kg m-2] |
Bias tena [kg m-2] |
Bias mide [kg m-2] |
Bias Score shaf [1] |
Bias Score seas [1] |
Bias Score aust [1] |
Bias Score nhaf [1] |
Bias Score tena [1] |
Bias Score ceam [1] |
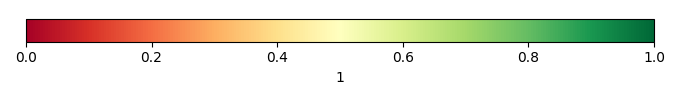
Bias Score [1] |
Bias Score ceas [1] |
Bias Score nhsa [1] |
Bias Score euro [1] |
Bias Score mide [1] |
Bias Score bona [1] |
Bias Score boas [1] |
Bias Score eqas [1] |
Bias Score shsa [1] |
Spatial Distribution Score eqas [1] |
Spatial Distribution Score tena [1] |
Spatial Distribution Score shaf [1] |
Spatial Distribution Score nhsa [1] |
Spatial Distribution Score ceam [1] |
Spatial Distribution Score seas [1] |
Spatial Distribution Score ceas [1] |
Spatial Distribution Score bona [1] |
Spatial Distribution Score [1] |
Spatial Distribution Score mide [1] |
Spatial Distribution Score nhaf [1] |
Spatial Distribution Score shsa [1] |
Spatial Distribution Score aust [1] |
Spatial Distribution Score boas [1] |
Spatial Distribution Score euro [1] |
Overall Score [1] |
|||
|---|---|---|---|---|---|---|---|---|---|---|---|---|---|---|---|---|---|---|---|---|---|---|---|---|---|---|---|---|---|---|---|---|---|---|---|---|---|---|---|---|---|---|---|---|---|---|---|---|---|---|---|---|---|---|---|---|---|---|---|---|---|---|---|---|---|---|---|---|---|---|---|---|---|---|---|---|---|---|---|---|---|---|---|---|---|---|---|---|---|---|---|---|---|---|---|---|---|---|---|---|---|---|---|---|---|---|---|---|---|---|---|---|---|---|---|---|---|---|---|---|---|---|---|---|
| Benchmark | [-] | 31.5 | 368. | 36.8 | 27.3 | 1.17 | 72.3 | 6.34 | 26.7 | 7.57 | 34.1 | 28.1 | 19.1 | 13.6 | 23.7 | 28.3 | ||||||||||||||||||||||||||||||||||||||||||||||||||||||||||||||||||||||||||||||||||||||||||||||||||||||||||||
| 20191109_storageparms | [-] | 41.7 | 515. | 38.5 | 29.4 | 2.07 | 128. | 5.67 | 38.3 | 9.84 | 33.5 | 42.6 | 25.9 | 15.8 | 33.4 | 52.4 | 29.4 | 41.6 | 5.61 | 42.6 | 9.84 | 38.1 | 52.4 | 33.4 | 33.3 | 2.02 | 25.9 | 38.5 | 515. | 15.8 | 128. | 0.0623 | 0.0278 | 0.0630 | 0.0420 | 0.737 | 0.0337 | 0.00 | 0.00326 | 0.214 | 0.00340 | 0.0508 | 0.00147 | 0.00 | 0.0699 | 0.00 | 13.4 | 1.11 | 28.1 | 27.0 | 18.8 | 36.7 | 362. | 26.3 | 6.14 | 72.2 | 26.4 | 23.6 | 33.7 | 7.45 | 31.1 | 0.206 | 0.294 | 0.402 | 0.406 | 0.118 | 0.0999 | 1.84 | 6.05 | 0.284 | 0.278 | 0.140 | 0.196 | 0.240 | 0.0615 | 0.0807 | 1.33 | 3.74 | 8.43 | 5.78 | 1.05 | 0.153 | 1.33 | -0.0159 | 0.410 | 0.856 | 1.32 | -0.0719 | 0.783 | 0.276 | 0.230 | 0.57 | 0.62 | 0.60 | 0.46 | 0.60 | 0.59 | 0.57 | 0.60 | 0.50 | 0.60 | 0.55 | 0.58 | 0.66 | 0.59 | 0.55 | 0.82 | 0.89 | 0.70 | 0.64 | 0.67 | 0.86 | 0.90 | 0.91 | 0.74 | 0.76 | 0.52 | 0.70 | 0.81 | 0.92 | 0.78 | 0.66 | ||
| ELM_v1default | [-] | 46.0 | 578. | 42.8 | 33.7 | 2.50 | 140. | 8.24 | 46.4 | 11.4 | 39.4 | 43.4 | 29.6 | 18.8 | 42.0 | 54.5 | 33.7 | 46.0 | 8.17 | 43.4 | 11.4 | 46.0 | 54.5 | 39.3 | 41.8 | 2.44 | 29.6 | 42.8 | 577. | 18.7 | 140. | 0.147 | 0.0322 | 0.0727 | 0.0697 | 1.12 | 0.0508 | 0.00 | 0.00443 | 0.385 | 0.00396 | 0.0552 | 0.00155 | 0.00 | 0.0798 | 0.00 | 13.4 | 1.11 | 28.1 | 27.0 | 18.8 | 36.7 | 362. | 26.3 | 6.14 | 72.2 | 26.4 | 23.6 | 33.7 | 7.45 | 31.1 | 0.206 | 0.294 | 0.402 | 0.406 | 0.118 | 0.0999 | 1.84 | 6.05 | 0.284 | 0.278 | 0.140 | 0.196 | 0.240 | 0.0615 | 0.0807 | 1.88 | 4.50 | 9.16 | 6.04 | 1.98 | 0.537 | 2.23 | 0.306 | 0.907 | 1.42 | 1.86 | 0.276 | 1.19 | 0.768 | 0.338 | 0.56 | 0.62 | 0.64 | 0.51 | 0.60 | 0.60 | 0.57 | 0.60 | 0.50 | 0.57 | 0.53 | 0.54 | 0.65 | 0.58 | 0.54 | 0.84 | 0.89 | 0.73 | 0.69 | 0.69 | 0.88 | 0.90 | 0.90 | 0.75 | 0.73 | 0.55 | 0.73 | 0.85 | 0.91 | 0.80 | 0.66 |
Temporally integrated period mean