Mean State
Download Data |
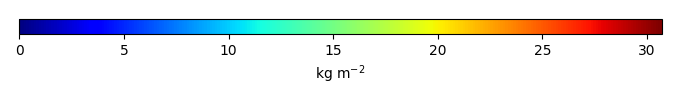
Period Mean (original grids) seas [Pg] |
Period Mean (original grids) [Pg] |
Period Mean (original grids) tena [Pg] |
Period Mean (original grids) mide [Pg] |
Period Mean (original grids) shsa [Pg] |
Period Mean (original grids) aust [Pg] |
Period Mean (original grids) ceam [Pg] |
Period Mean (original grids) ceas [Pg] |
Period Mean (original grids) eqas [Pg] |
Period Mean (original grids) nhsa [Pg] |
Period Mean (original grids) shaf [Pg] |
Period Mean (original grids) nhaf [Pg] |
Model Period Mean (intersection) tena [Pg] |
Model Period Mean (intersection) seas [Pg] |
Model Period Mean (intersection) aust [Pg] |
Model Period Mean (intersection) shsa [Pg] |
Model Period Mean (intersection) nhaf [Pg] |
Model Period Mean (intersection) eqas [Pg] |
Model Period Mean (intersection) ceam [Pg] |
Model Period Mean (intersection) ceas [Pg] |
Model Period Mean (intersection) shaf [Pg] |
Model Period Mean (intersection) mide [Pg] |
Model Period Mean (intersection) nhsa [Pg] |
Model Period Mean (intersection) [Pg] |
Model Period Mean (complement) shaf [Pg] |
Model Period Mean (complement) seas [Pg] |
Model Period Mean (complement) aust [Pg] |
Model Period Mean (complement) [Pg] |
Model Period Mean (complement) eqas [Pg] |
Model Period Mean (complement) nhaf [Pg] |
Model Period Mean (complement) shsa [Pg] |
Model Period Mean (complement) mide [Pg] |
Model Period Mean (complement) tena [Pg] |
Model Period Mean (complement) ceam [Pg] |
Model Period Mean (complement) ceas [Pg] |
Model Period Mean (complement) nhsa [Pg] |
Benchmark Period Mean (intersection) mide [Pg] |
Benchmark Period Mean (intersection) nhsa [Pg] |
Benchmark Period Mean (intersection) [Pg] |
Benchmark Period Mean (intersection) eqas [Pg] |
Benchmark Period Mean (intersection) aust [Pg] |
Benchmark Period Mean (intersection) ceas [Pg] |
Benchmark Period Mean (intersection) shsa [Pg] |
Benchmark Period Mean (intersection) nhaf [Pg] |
Benchmark Period Mean (intersection) shaf [Pg] |
Benchmark Period Mean (intersection) tena [Pg] |
Benchmark Period Mean (intersection) seas [Pg] |
Benchmark Period Mean (intersection) ceam [Pg] |
Benchmark Period Mean (complement) aust [Pg] |
Benchmark Period Mean (complement) nhaf [Pg] |
Benchmark Period Mean (complement) seas [Pg] |
Benchmark Period Mean (complement) ceas [Pg] |
Benchmark Period Mean (complement) ceam [Pg] |
Benchmark Period Mean (complement) eqas [Pg] |
Benchmark Period Mean (complement) [Pg] |
Benchmark Period Mean (complement) tena [Pg] |
Benchmark Period Mean (complement) shsa [Pg] |
Benchmark Period Mean (complement) mide [Pg] |
Benchmark Period Mean (complement) nhsa [Pg] |
Benchmark Period Mean (complement) shaf [Pg] |
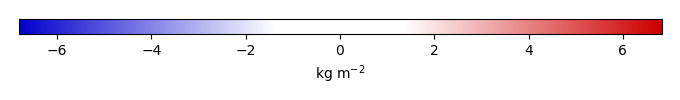
Bias seas [kg m-2] |
Bias shsa [kg m-2] |
Bias nhsa [kg m-2] |
Bias eqas [kg m-2] |
Bias shaf [kg m-2] |
Bias nhaf [kg m-2] |
Bias ceas [kg m-2] |
Bias [kg m-2] |
Bias aust [kg m-2] |
Bias tena [kg m-2] |
Bias mide [kg m-2] |
Bias ceam [kg m-2] |
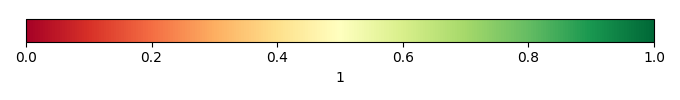
Bias Score shaf [1] |
Bias Score seas [1] |
Bias Score aust [1] |
Bias Score nhaf [1] |
Bias Score tena [1] |
Bias Score [1] |
Bias Score ceas [1] |
Bias Score ceam [1] |
Bias Score nhsa [1] |
Bias Score mide [1] |
Bias Score eqas [1] |
Bias Score shsa [1] |
Spatial Distribution Score eqas [1] |
Spatial Distribution Score tena [1] |
Spatial Distribution Score shaf [1] |
Spatial Distribution Score nhsa [1] |
Spatial Distribution Score ceam [1] |
Spatial Distribution Score nhaf [1] |
Spatial Distribution Score ceas [1] |
Spatial Distribution Score seas [1] |
Spatial Distribution Score [1] |
Spatial Distribution Score mide [1] |
Spatial Distribution Score shsa [1] |
Spatial Distribution Score aust [1] |
Overall Score [1] |
|||
|---|---|---|---|---|---|---|---|---|---|---|---|---|---|---|---|---|---|---|---|---|---|---|---|---|---|---|---|---|---|---|---|---|---|---|---|---|---|---|---|---|---|---|---|---|---|---|---|---|---|---|---|---|---|---|---|---|---|---|---|---|---|---|---|---|---|---|---|---|---|---|---|---|---|---|---|---|---|---|---|---|---|---|---|---|---|---|---|---|---|---|---|---|---|---|---|---|---|---|---|---|
| Benchmark | [-] | 57.3 | 352. | 0.794 | 0.216 | 95.5 | 13.7 | 10.3 | 24.2 | 37.5 | 30.6 | 38.4 | 34.3 | |||||||||||||||||||||||||||||||||||||||||||||||||||||||||||||||||||||||||||||||||||||||
| 20191109_storageparms | [-] | 41.7 | 515. | 29.4 | 2.06 | 128. | 5.64 | 9.83 | 33.5 | 42.6 | 52.3 | 33.3 | 38.3 | 2.19 | 41.7 | 3.07 | 128. | 38.3 | 42.6 | 9.83 | 12.7 | 33.3 | 0.00269 | 52.3 | 376. | 0.00720 | 0.000660 | 2.56 | 139. | 0.00 | 0.0241 | 0.00173 | 2.06 | 27.2 | 0.00 | 20.7 | 0.00 | 0.215 | 30.4 | 346. | 35.0 | 13.5 | 23.8 | 95.2 | 34.0 | 38.2 | 0.792 | 56.6 | 10.1 | 0.237 | 0.376 | 0.708 | 0.312 | 0.224 | 2.55 | 5.96 | 0.00223 | 0.324 | 0.00107 | 0.244 | 0.151 | -1.84 | 2.20 | 7.63 | 2.71 | -0.511 | 0.418 | -1.80 | 0.450 | -1.74 | 1.92 | -0.530 | -0.0995 | 0.58 | 0.66 | 0.45 | 0.50 | 0.57 | 0.60 | 0.49 | 0.64 | 0.54 | 0.37 | 0.72 | 0.62 | 0.79 | 0.54 | 0.73 | 0.57 | 0.85 | 0.60 | 0.54 | 0.90 | 0.70 | 0.0053 | 0.70 | 0.77 | 0.65 | ||
| ELM_v1default | [-] | 46.0 | 577. | 33.7 | 2.49 | 140. | 8.17 | 11.4 | 39.4 | 43.4 | 54.5 | 41.9 | 46.4 | 2.44 | 46.0 | 5.12 | 140. | 46.4 | 43.4 | 11.4 | 15.3 | 41.8 | 0.00293 | 54.5 | 418. | 0.0105 | 0.000790 | 3.05 | 159. | 0.00 | 0.0316 | 0.00198 | 2.49 | 31.3 | 0.00 | 24.1 | 0.00 | 0.215 | 30.4 | 346. | 35.0 | 13.5 | 23.8 | 95.2 | 34.0 | 38.2 | 0.792 | 56.6 | 10.1 | 0.237 | 0.376 | 0.708 | 0.312 | 0.224 | 2.55 | 5.96 | 0.00223 | 0.324 | 0.00107 | 0.244 | 0.151 | -1.31 | 2.95 | 8.37 | 2.97 | 0.382 | 1.20 | -1.38 | 1.09 | -1.40 | 2.25 | -0.529 | 0.462 | 0.67 | 0.69 | 0.52 | 0.58 | 0.57 | 0.63 | 0.53 | 0.67 | 0.53 | 0.37 | 0.72 | 0.63 | 0.81 | 0.54 | 0.77 | 0.62 | 0.87 | 0.63 | 0.55 | 0.92 | 0.73 | 0.0063 | 0.74 | 0.84 | 0.68 |
Temporally integrated period mean